These days no matter on which profile you are working, from accountant to data analyst, HR to product manager, having Excel skills have huge benefits.
When we talk about Excel skills, we can further categorize them in 3 levels:
- Basic Excel Skills
- Intermediate Excel Skills
- Advanced Excel Skills
And in this tutorial, we will be covering all these three levels in detail, one by one, so let’s get started.
Video Tutorial: Check Top 10 Excel Skills out of the Top 25
Read Also – Describe Your Excel Skills on Resume
Basic Excel Skills
Below you have the top ten basic Excel skills to learn by anyone who is just starting out with Excel needs to learn.
1. Saving and Opening a Workbook
Saving and opening an Excel workbook is just like as you do in any other application.
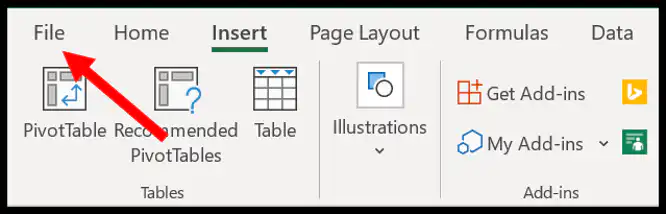
When you click on the file tab it shows you the option to save the file.

And when you click on the save button it opens the save as dialog box from where you can specify the location and you can also select the file format to use.
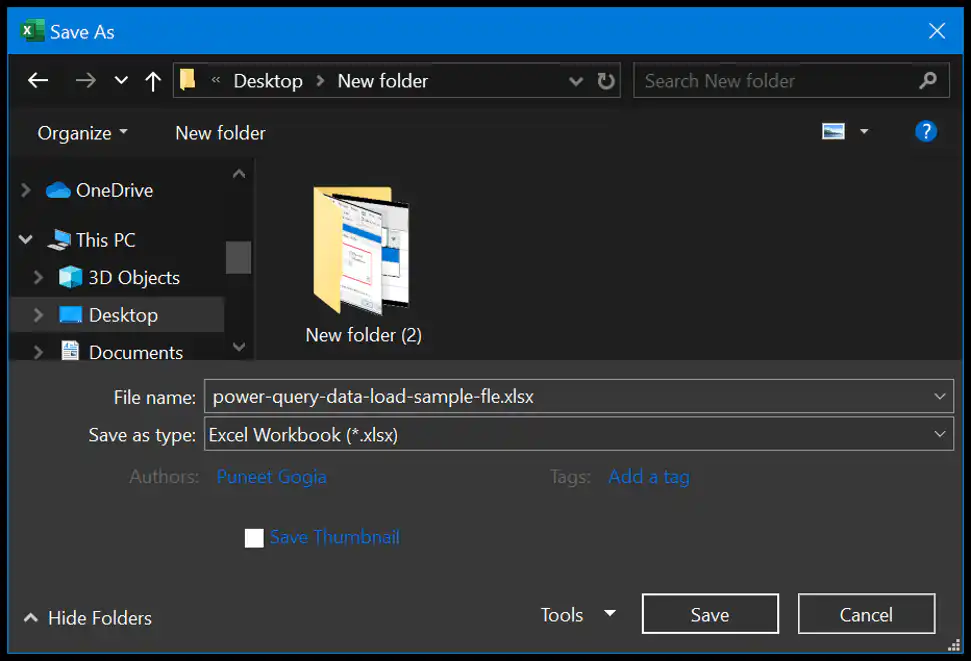
Basically, Excel has different file extensions that you can use for saving a workbook. You can use the above steps if you are saving a file for the first time and if you have a file that is already saved in the system, you just need to press Control + S to save the changes.
In the same way, if you want to open a file that is saved on your system you can go to the FILE tab and click on the open.

It shows you the open dialog box from where you can locate the file and open it.
2. Managing Worksheets
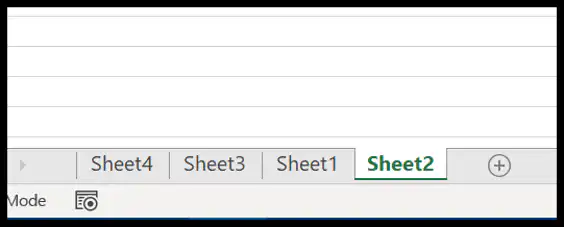
Every workbook consists of worksheets where you can add your data and analyze it and once you open an Excel workbook you can see there are tabs at the bottom of the window.
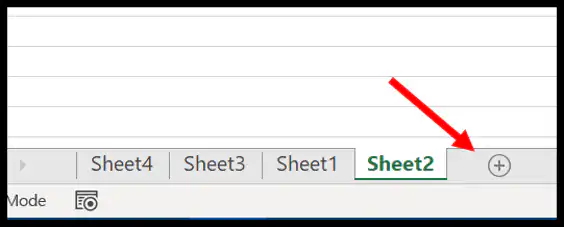
To insert a new worksheet simply click on the plus button or you can also use the shortcut key Shift + F11.
And if you want to delete a worksheet just right-click on the worksheet tab and then select the delete option or you can also use the shortcut key Alt ➜ H ➜ D ➜ S.
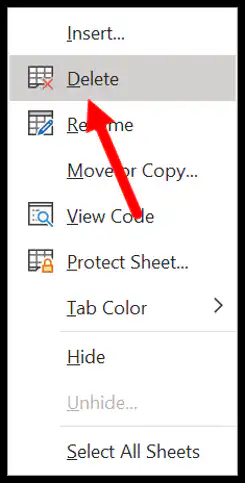
But there’s one thing that you need to take care that once you delete a worksheet you can’t get it back.
3. Formatting Cells
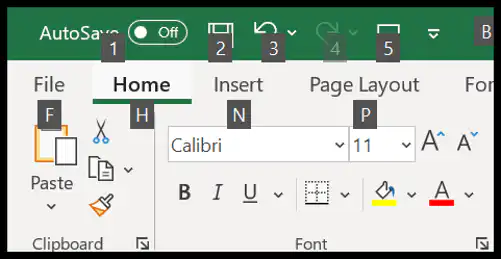
In Excel, you have a bunch of options on the home tab for formatting.
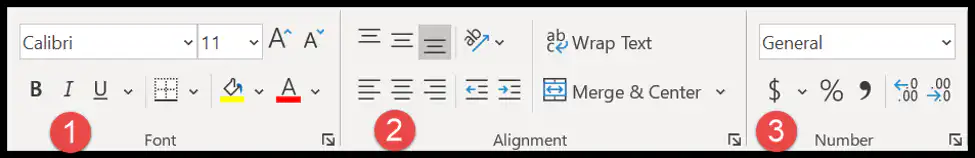
- The font group gives you the option to format the font by making it bold, italic, and underline. You can change the font size, and color of the font and cell color.
- From the alignment group, you can define the alignment of the text, add indent, merge-unmerge cells, and wrap the text.
- And from the number group, you can apply accounting format, text format, number format with or without comma style, etc.
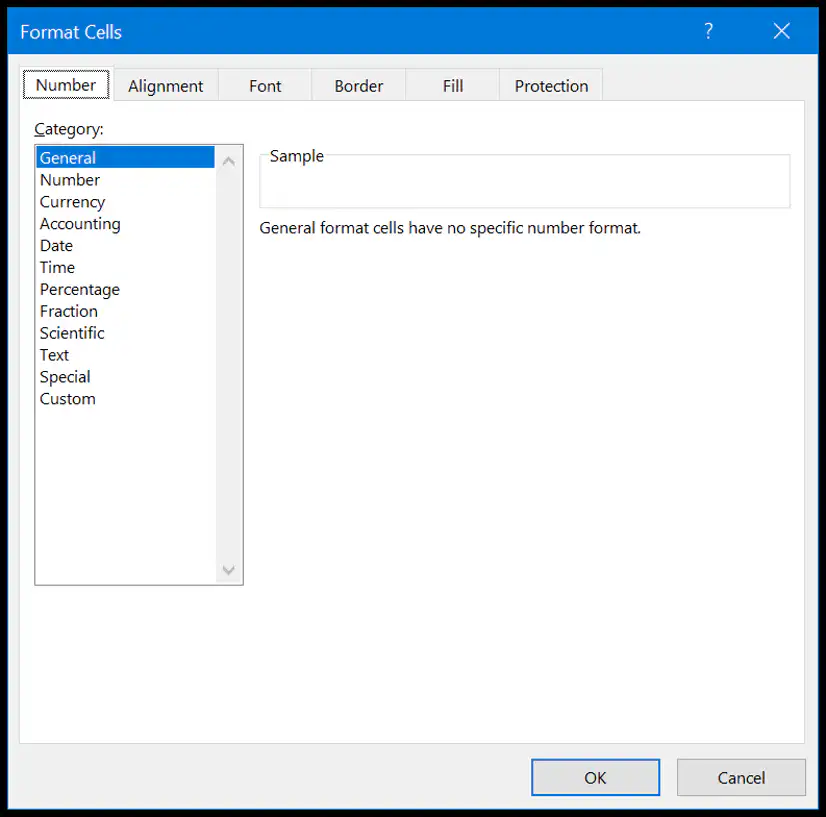
Apart from the above options, you can also open the format cell options by right-clicking on a cell and selecting the format option or you can also use the shortcut key Control + 1.
4. Printing
When you go to the File tab, you can find there is a print button that further includes all the printing options that you can use for printing data from a worksheet.
You can also use the shortcut key Control + P to open the print option and once you open it you can see the following options there:
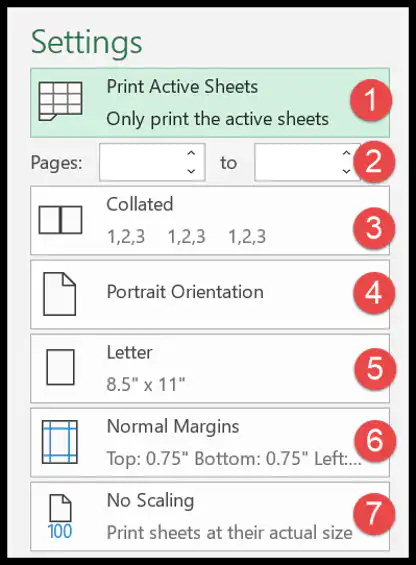
- Print Area
- Range of Pages to Print
- Collision
- Page Orientation
- Page Type
- Margins
- Scaling
5. Excel Functions (Basic)
The biggest power of Excel is its functions that you can use to perform a lot of calculations below you have a list of the top ten Basic Excel Functions:
- SUM: With this function, you can sum values from multiple cells, or you can also input values directly into the function.
- COUNT: This function returns the count of numeric values in a cell. You can refer to the cells where you have values or simply insert the values into them.
- AVERAGE: It returns the average of numeric values. You can refer to the cells where you have the values or simply insert them into the function.
- TIME: It returns a valid time serial number as per Excel’s time format. You need to specify hours, minutes, and seconds.
- DATE: It returns a valid date (date serial number) as per Excel’s time format by using the day, month, and year specified.
- LEFT: It extracts specific characters from a cell/string starting from the left (start). You need to specify the text and number of characters to extract.
- RIGHT: It extracts specific characters from a string starting from the right (last). You need to specify the text and number of characters to extract.
- VLOOKUP: It looks up a value in a column and can return that value or a value from the corresponding columns using the same row number.
- IF: IF function (tests a condition) returns a value when the specific condition is TRUE and returns another value if that condition is FALSE.
- NOW: It returns the current date and time (using your system’s settings) in the cell where you insert it.
Here are the Top 100 Excel Functions for you to learn more.
6. Charts
Once you start working on data probably you need to present it to someone, and a chart is one of the best ways to do this.
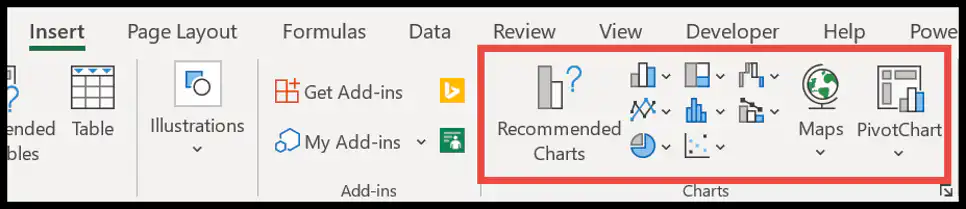
In Excel, you have a whole list of charts that you can create. Once you go to the Insert tab, and in the charts group you can find all the charts which are available to use.
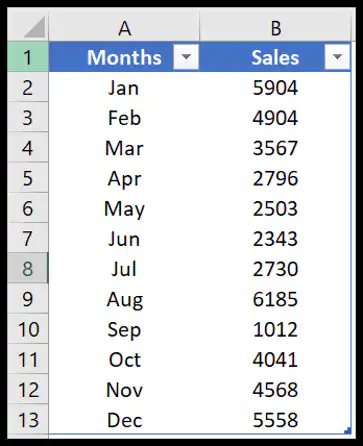
But to create a chart in Excel you need to have data in the right format, and then you need to select the right type of chart (make sure to check out this guide on chart types). For example, below you have 12 months of data for the sales quantity.
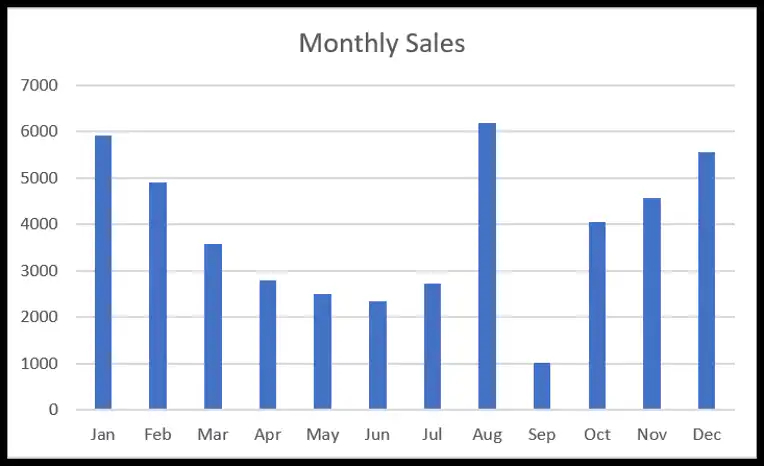
You can create a column chart to present this monthly data.
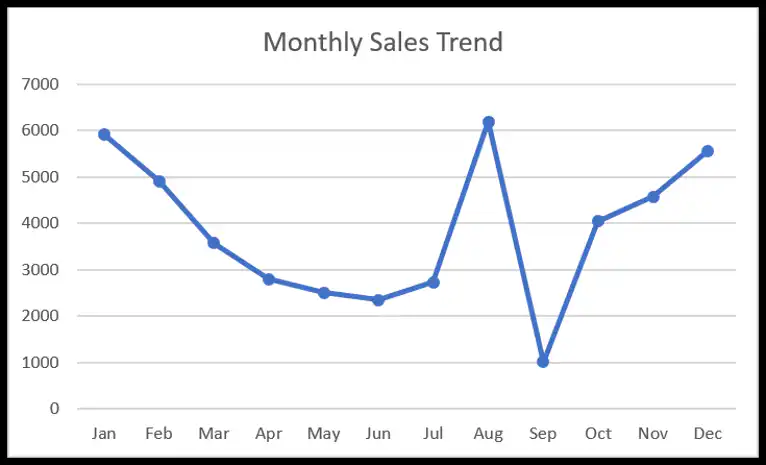
But you can also use a line chart if you want to show the trend for the 12 months.
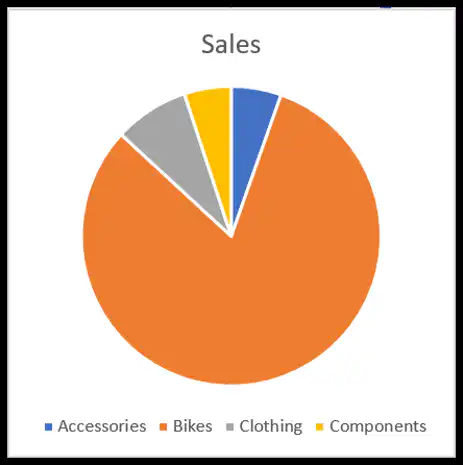
But below you have product-wise data.
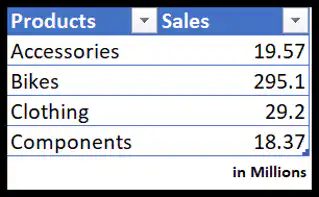
And in this case, the perfect chart would be a pie chart where you can present the quantity share of these products.
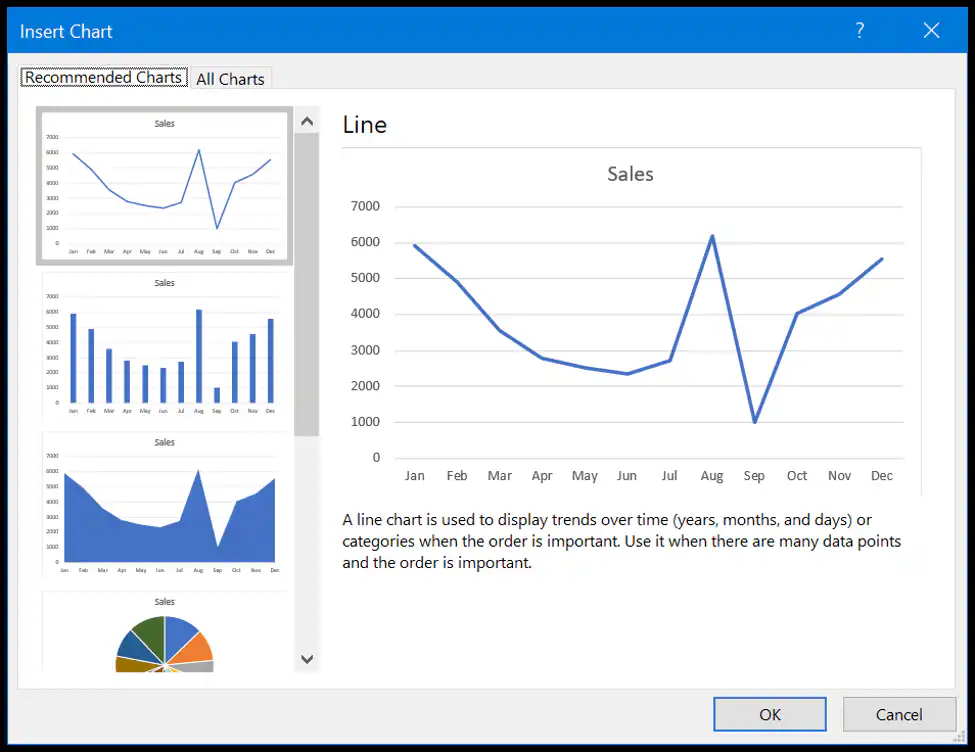
You can also use the recommended charts button to let Excel recommend a chart type according to the data you have.
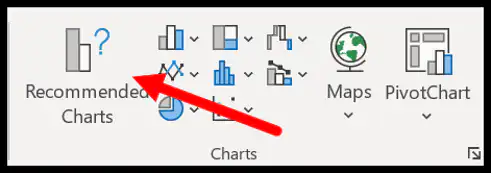
You just need to select the data and click on the recommended chart button.
You can customize a chart in different ways. Once you select the chart you will have Chart Design and Format tabs where you have all the options for customization.

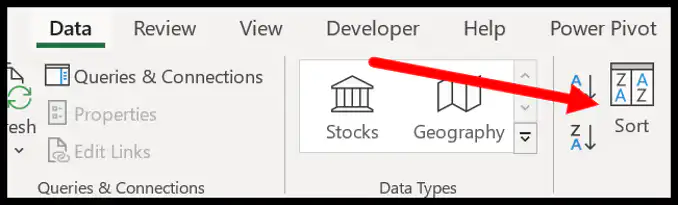
7. Sorting Data
Excel gives you a powerful option to sort data. To open the sort option, you need to go to the Data Tab and then click on the Sort button.
Now here you have 3 things to define:
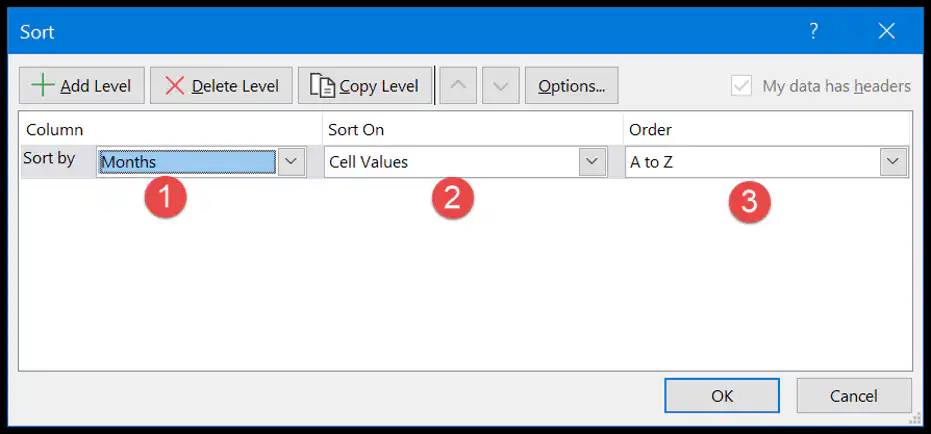
- Sort by: The column to use as the base of sorting.
- Sort on: In the sort drop-down, you have 4 different options to sort values on. You can use cell value, cell color, font color, and conditional formatting.
- Order: The order of sorting or a custom order.
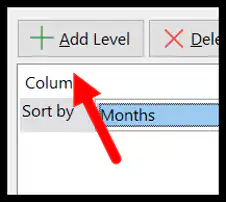
You can also use more than one level of sorting. If you want to add a new level simply click on the Add Level and then define all the three things that we have discussed above.
Related: Sort By Date, Date and Time & Reverse Date Sort
8. Find and Replace Option
Just like any other application, Excel has its own find and replace option. The shortcut key to open the find is Control +F and to find and replace it is Control + R.
In the “Find what” input bar, enter the value that you want to find, and in the “Replace with” enter the value with which you want to replace.
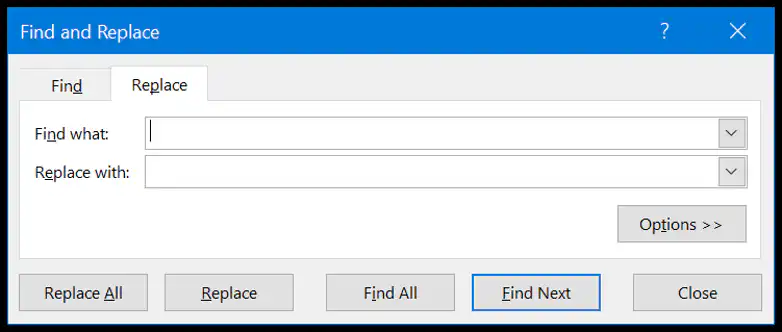
Now if you want to replace or find all the values, use the replace all or find all buttons, otherwise, you can use the “Find Next” and “Replace” buttons for a single value. And once you click on the options button, you’ll see that there are some advanced options that you can use.
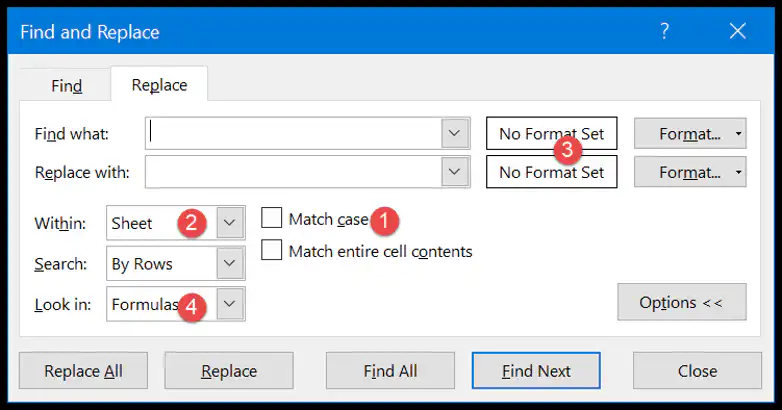
- Perform case-sensitive find and replace.
- Find and replace in the entire workbook.
- Find and replace using the cell format.
- And you can also find values from comments and notes.
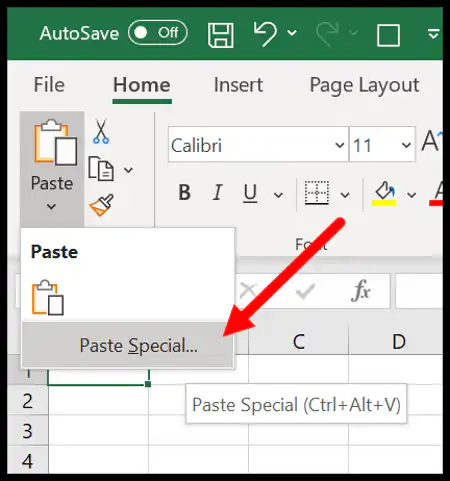
9. Paste Special Option
The paste special option gives you complete control over how you want to paste values in a cell.

To open the page special option, you need to go to the Home tab and then click on the dropdown “Paste” and click on the paste special (You can also open the page special from the right-click menu).
In the paste special dialog box, you have multiple options that you can use.
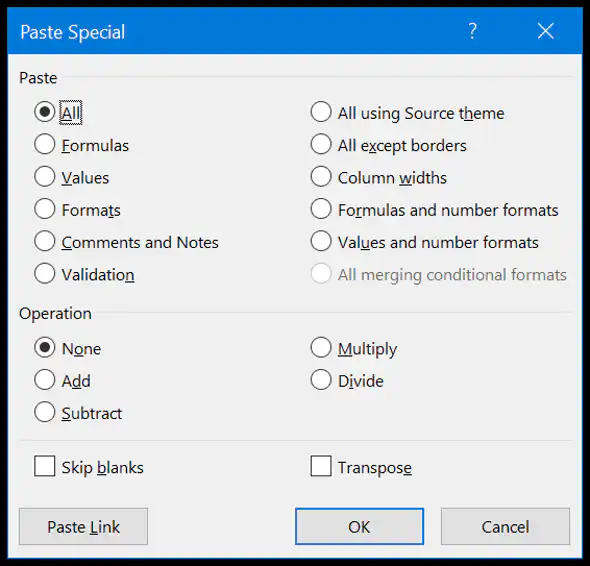
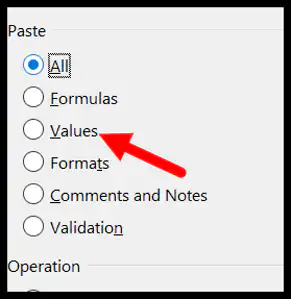
Let’s say, you have a cell where you have a formula, but you only want to copy and paste the value from that cell. In this case, simply copy that cell and use the “Values” option from the paste special options on the destination cell.
Or if you want to copy and paste the format from one cell to another you can use the “Formats” option.
Related: Format Painter | Transpose
10. Keyboard Shortcuts
From Excel 2007 to Excel 2019, you can locate a keyboard shortcut by pressing the ALT key. On pressing it, it shows the shortcut keys for the options which are there on the ribbon, just like below.

From here you can download the Excel Shortcuts Cheat Sheet which covers the top eighty-two keyboard shortcuts for Excel.
Intermediate Excel Skills
Now once you master the basic stuff the next thing you need to understand is the Intermediate Excel Skills. These skills include options and methods to manage and work data efficiently.
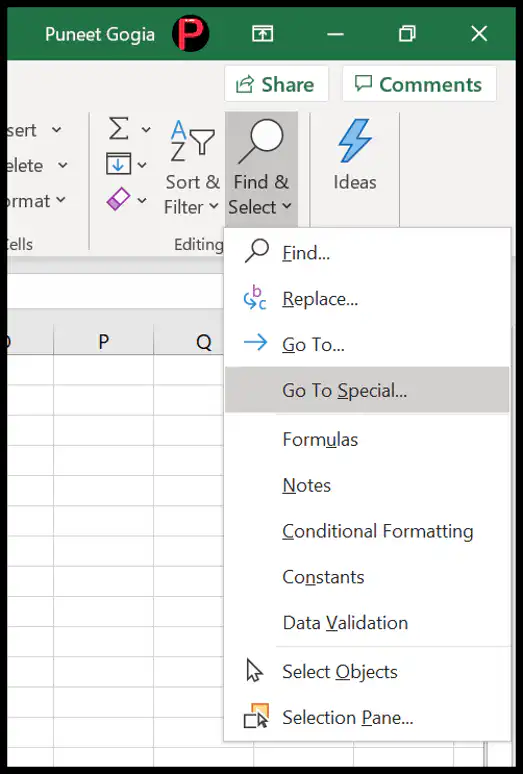
11. Go To Special
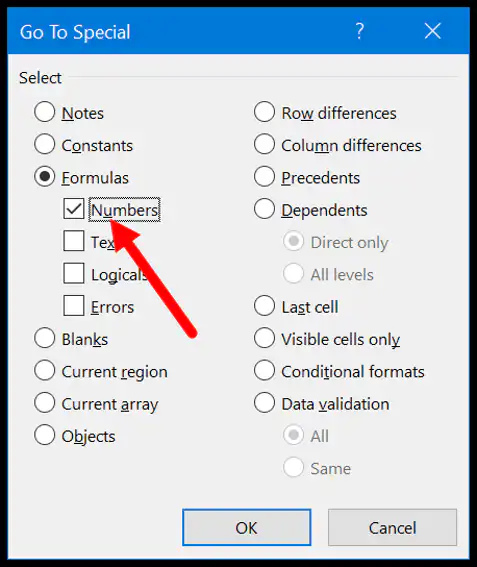
The GO TO SPECIAL option helps you navigate to a specific cell or a range of cells within the worksheet. To open it you need to go to the Home Tab ➜ Editing ➜ Find and Select ➜ Go To special.
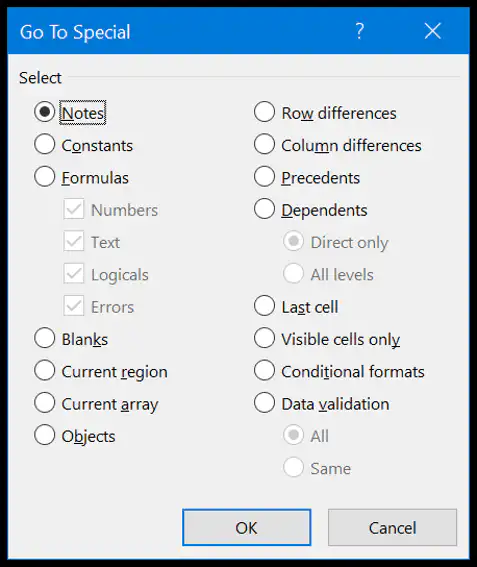
As you can see it has different options that you can use and select the different kinds of cells.
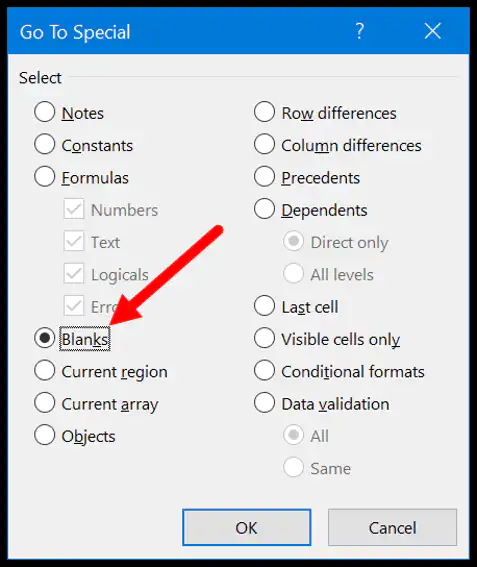
For example, if you want to select all the cells which are blank, you need to select the blank and click OK, and it will instantly select all the blank cells.
In the same way, if you want to select cells that have formulas and return numbers, you need to select formulas and then tick-mark numbers, and then click OK.
12. Pivot Table
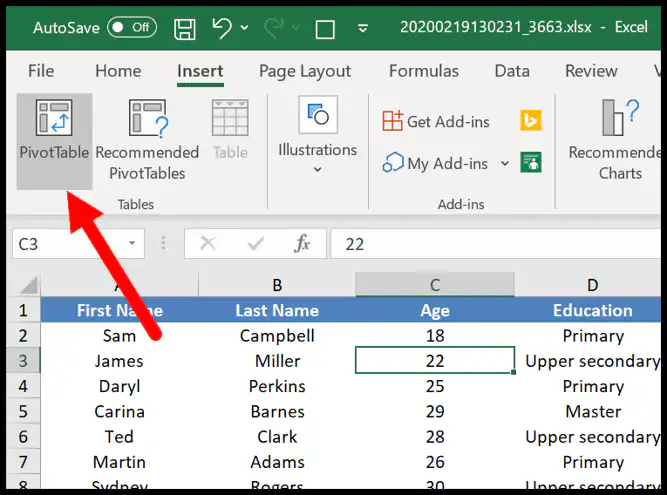
Pivot Tables are one of the best ways to analyze data. You can create a summary table out of a large data set. To create a pivot table, follow the below steps:

- First, go to the Insert Tab and click on the pivot table button.
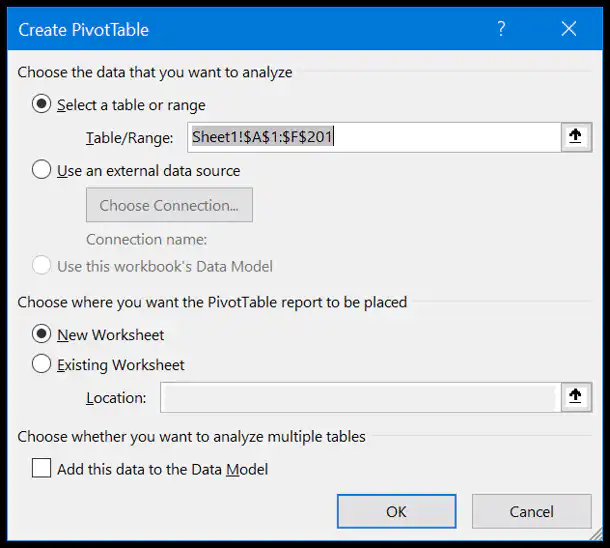
- You’ll have a dialog box to specify the source data, but as you have already selected the data it takes the range automatically.
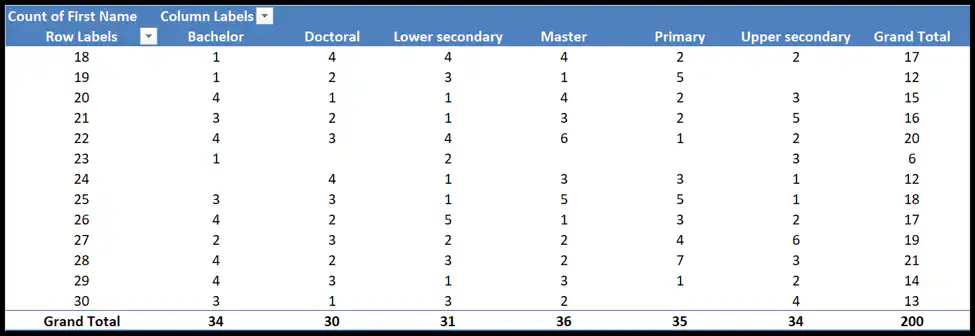
- Once you click OK, you will have a sidebar just like below where you can define the rows, columns, and values for the pivot table that you can simply drag and drop. And now, add “Age” to the rows, “Education” to the column, and “First Name” to the values.
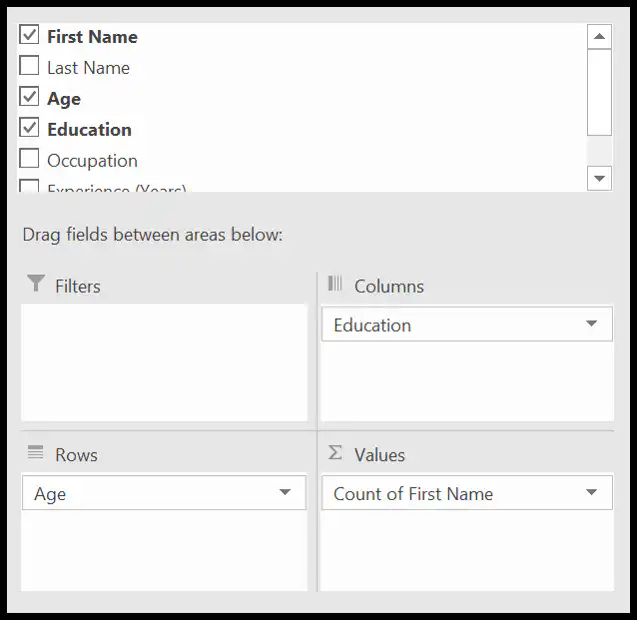
Once you define all, you’ll have a pivot chart like the one below.

More on Pivot Tables
- Rank in a Pivot Table
- Update Pivot Table Range Automatically
- Pivot Table Calculated Field
- Grouping Dates in Pivot Table
- Link multiple Pivot Tables to One Slicer
- Add a Date Timeline to the Current Pivot Table
- Refresh All Pivot Tables
- Running total in Pivot Table
13. Named Range
Named Range is about giving a name to a cell or range of cells. In Excel, every cell has its address which is a combination of row and column.

Related: Excel R1C1 Style
But with the named range you can give that cell or the range of cells a specific name (Generic) and then you can use that name to refer to it.
Let’s say you have a tax percentage in cell A1 and now instead of using the reference, you can give a name to it and then use that name in every calculation.
- To create a named range, you need to go to the Formula Tab ➜ Define Names ➜ Define name.
- Now in the define name dialogue box, you need to define the following things:
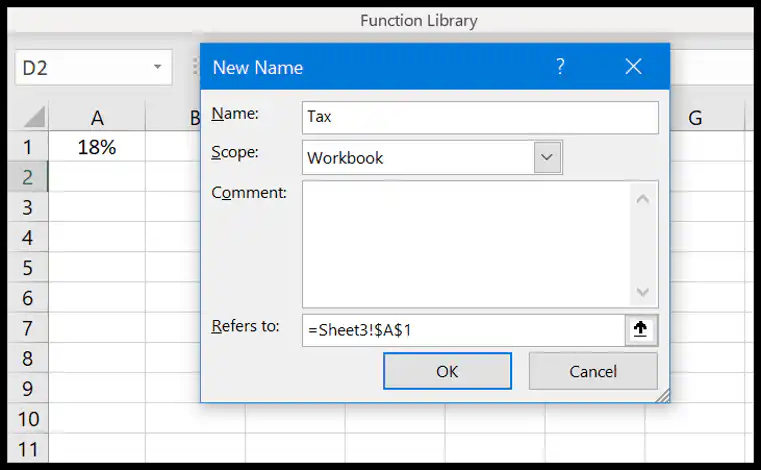
- Name of the range.
- Scope to use that range in the entire workbook or just in the worksheet.
- Comment if you want to add any.
- And then the address of the cell or the range.
Now once you click OK, Excel will assign that name to cell A1 and you can use that in formulas to refer to cell A1.
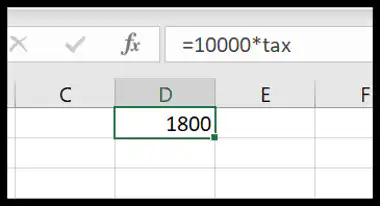
In the same way, you can also create a named range for the range of cells and then you can refer to it in the formulas.
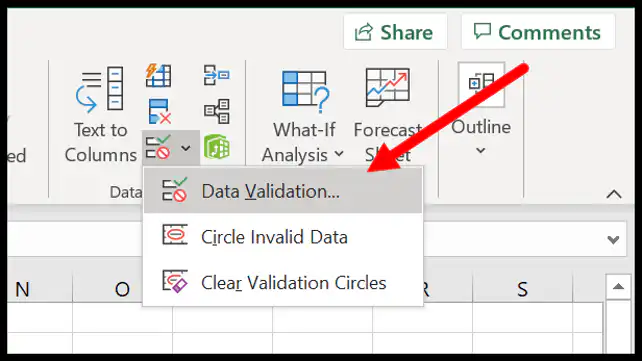
14. Drop Down Lists
A drop-down list is basically a predefined list of values that can help you quickly enter the data in a cell. To create a dropdown list, you need to go to the Data Tab ➜ Data Tools ➜ Data Validation ➜ Data Validation.

Now in the data validation dialog box, you need to select the list from the allow, and then in the source you need to refer to the range from where you want to take values (You can also insert values directly into the source input box).
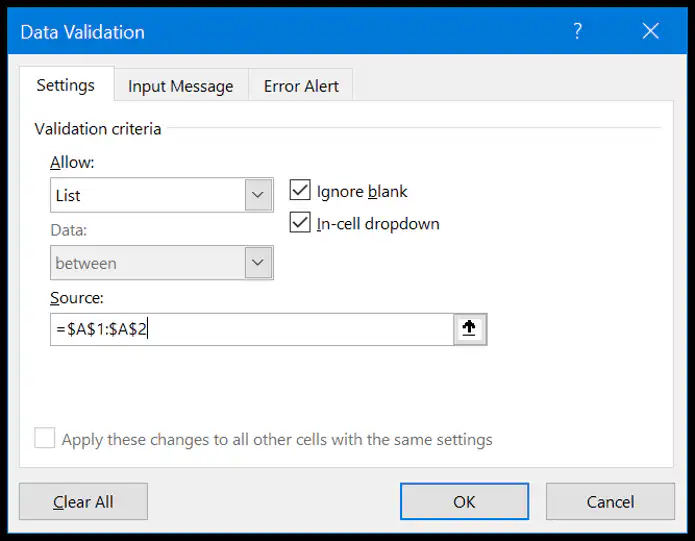
In the end, click OK
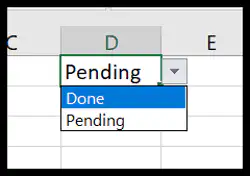
Now when you go back to the cell, you’ll have a dropdown list from which you can select the value to insert into the cell.
More on Drop Down Lists
15. Conditional Formatting
The basic idea of conditional formatting is to use conditions and formulas for formatting and the best part is there are more than 20 options that you can apply with a single click.
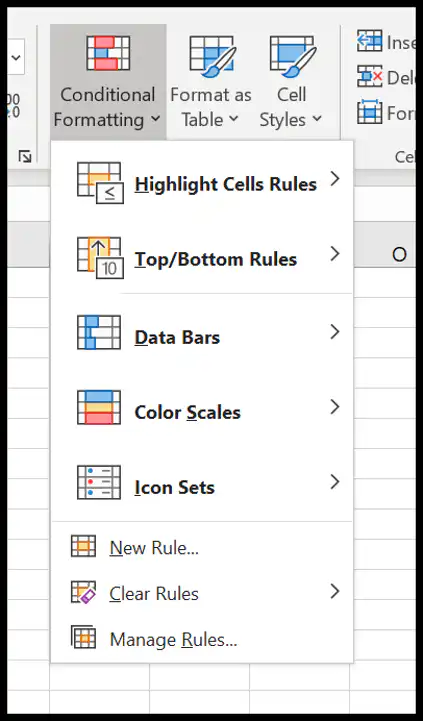
Let’s say you want to highlight all the duplicate values from a range of cells, you just need to go to the Home Tab ➜ Conditional Formatting ➜ Highlight Rules ➜ Duplicate Values.
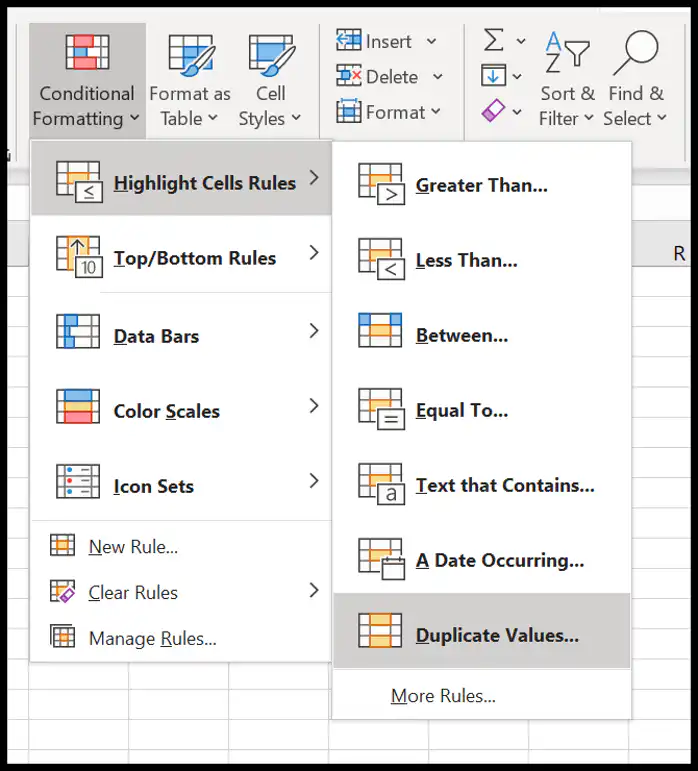
And you also have data bars, color skills, and icons to apply.
Make sure to explore all the options and check out this guide if you want to learn to use formulas in conditional formatting.
16. Excel Table
Excel table converts normal data into a structured table where you can sort, filter, and analyze data easily.
To convert your normal data into an Excel table all you need to do is use the keyboard shortcut key Control + T or you can also go to the Insert tab ➜ Table.
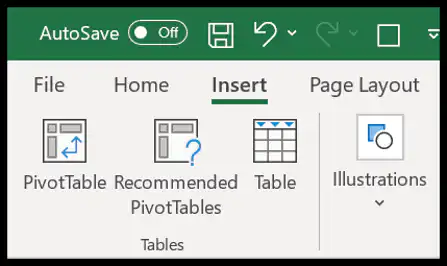
Excel tables by Microsoft | Rename an Excel Table | Excel Slicer
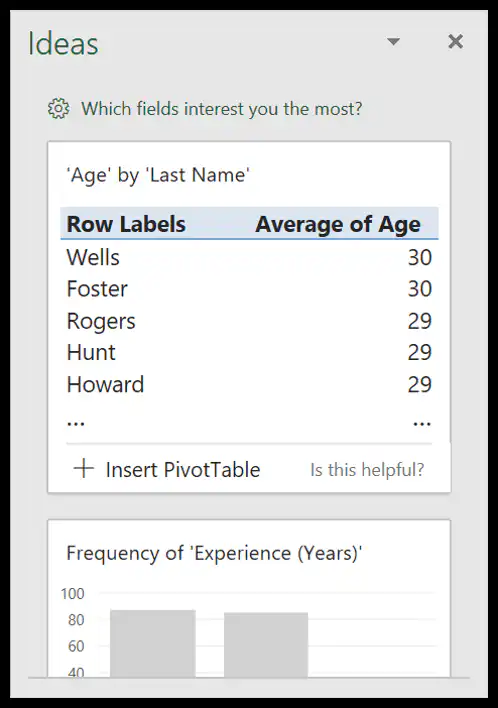
17. Idea Button
If you’re using Office 365 you can have access to the new Idea Button introduced by Microsoft that can help you to analyze your data in an easy way by recommending the possible ways to create:
- Pivot Tables
- Trendline Charts
- Frequency Distribution Chart
You simply need to select the data and then click on the idea button which is on the home tab.

It takes a few seconds to analyze the data and then show you a list of possible outcomes.
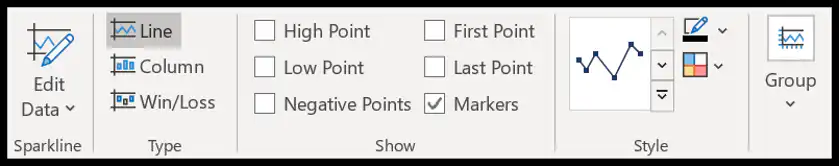
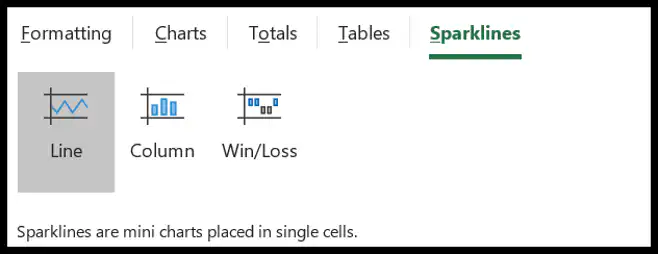
18. Using Sparklines
Sparklines are tiny charts you can insert into a cell, based on a range of data.

To insert a sparkline you need to go to the Insert Tab ➜ Sparklines.
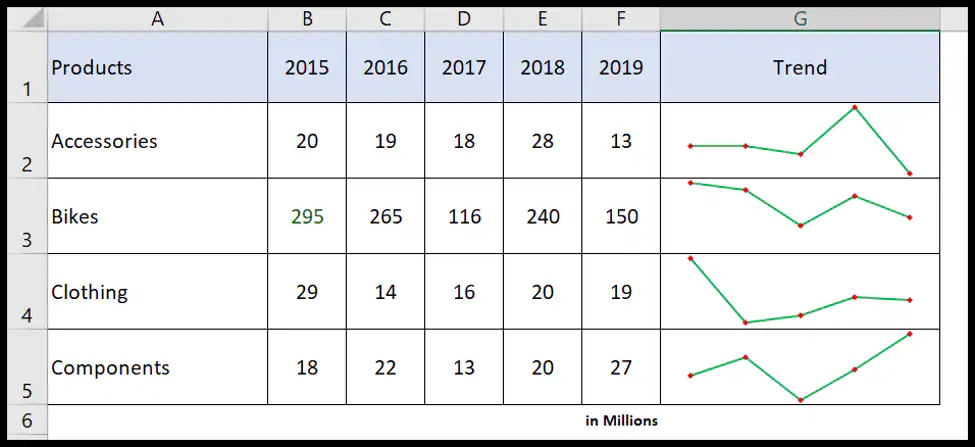
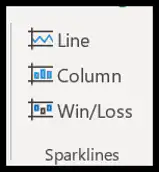
There are 3 types of sparklines that you can insert into a cell.
- Line
- Column
- Win-Loss
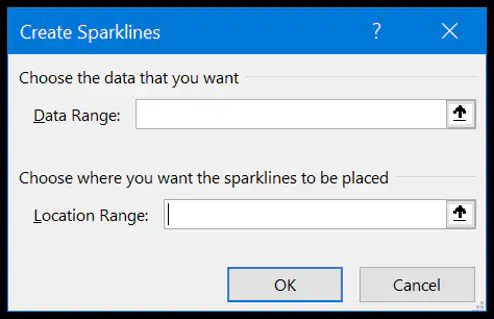
When you click on the sparkling button it shows you a dialog box where you need to select the data range and the destination range of the sparkling.
Apart from this, you have options to customize a sparkline by changing its color, adding markers, and much more from the sparkline tab.
19. Text to Column
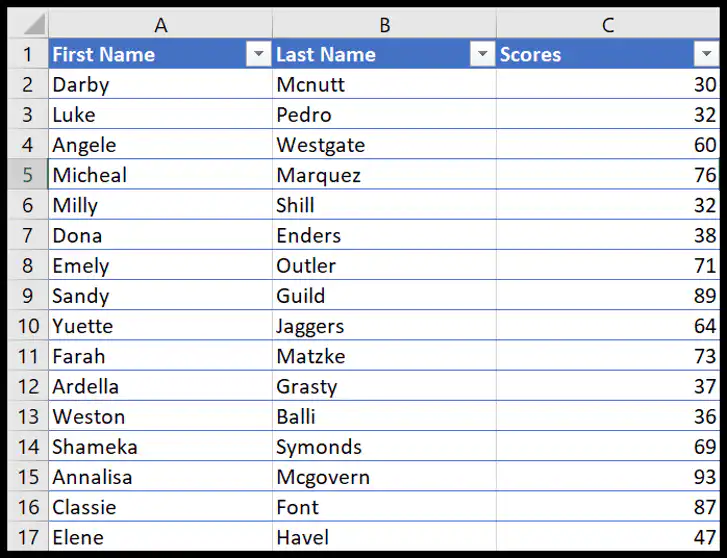
With the text-to-column option, you can split a single column into multiple columns using a separator. It’s one of the best ways to clean and transform your data.
Look at the below table where you have a column with names and between first name and last name there is a space.
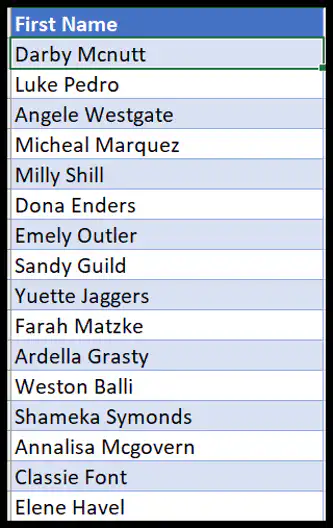
You can split this column into two different columns (first name and last name) using text to column by using space as a separator.
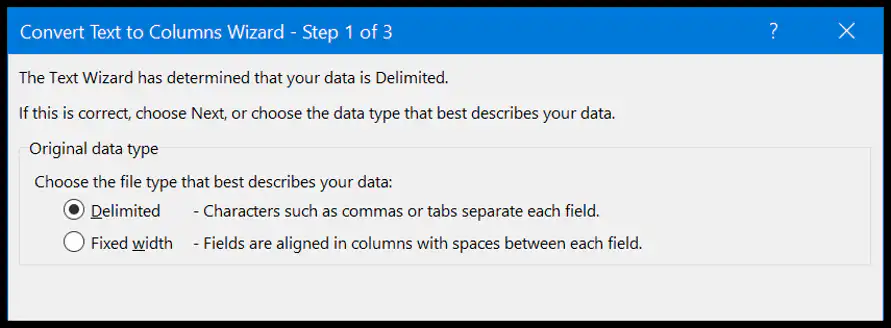
- First, go to the Data Tab and click on the Text to Column.
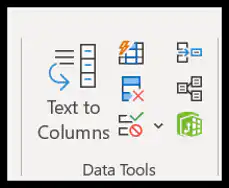
- Now, from the dialog box select delimiter and click next.
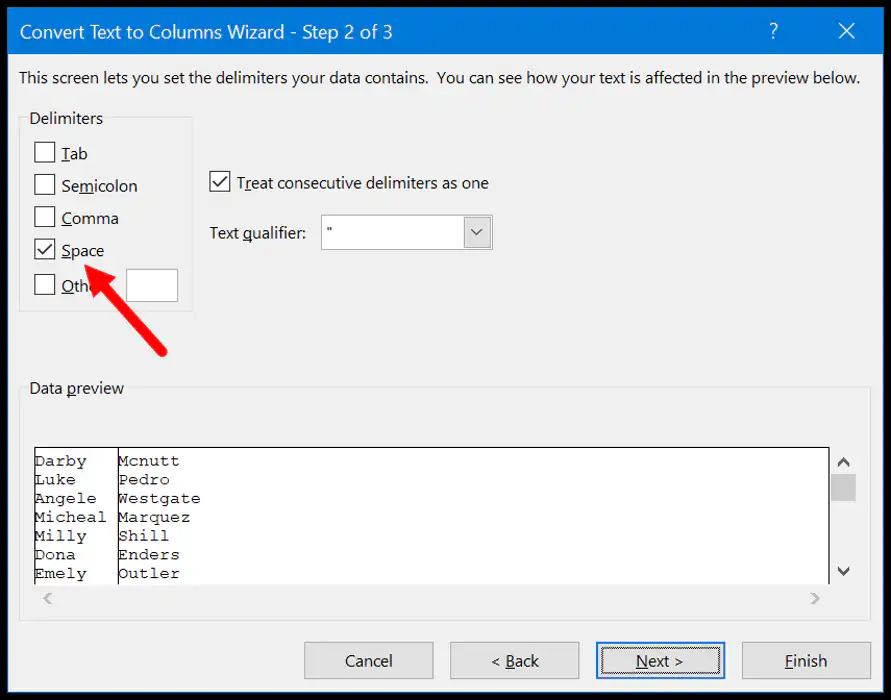
- After that, tick-mark the space. As you can see it has separated values from the column using the space.
- In the end, click next and then finish.
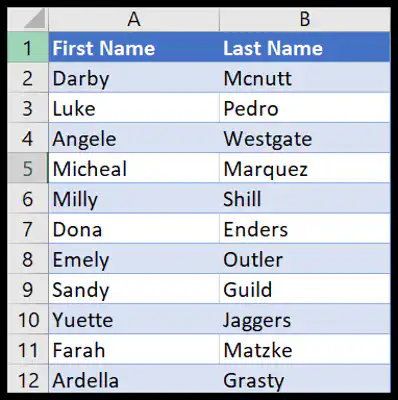
The moment you click the finish, it converts that one column of full names into two different columns (first and last name).
20. Quick Analysis Tool
As the name suggests the Quick Analysis Tool allows you to analyze the data with one or two clicks. What I’m trying to say is, it has some of the selected options that can help you to analyze and present the data.

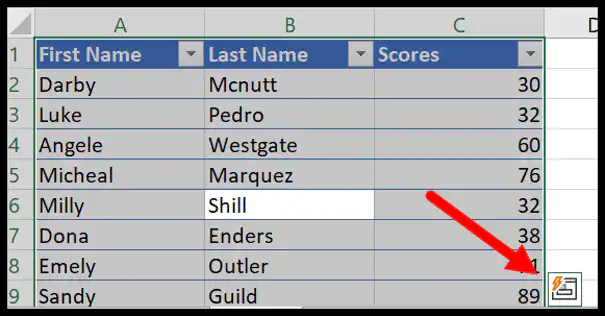
Below you have student data with their score the moment you select it you get a small icon at the bottom of the screen which is the button for the quick analysis tool.
Now when you click on it, it shows you a few tabs from which you can select options. Now let’s explore each tab one by one.
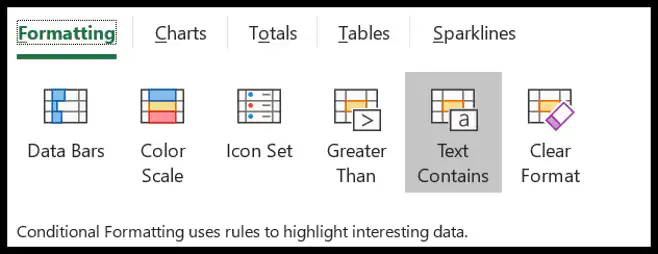
- Formatting: This tab allows you to add conditional formatting to the selected table, like, as data bars, color scale, icon sets, and other conditional formatting rules.
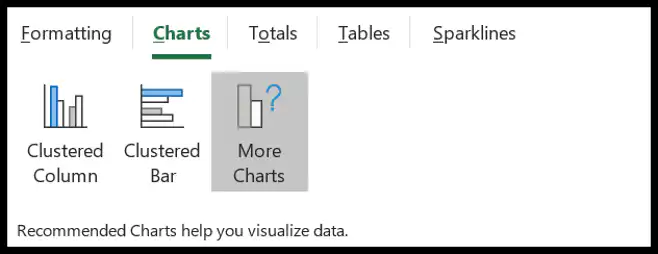
- Charts: This tab shows you some of the recommended charts which you can insert with the selected data or you can also click on more charts to select a specific chart.
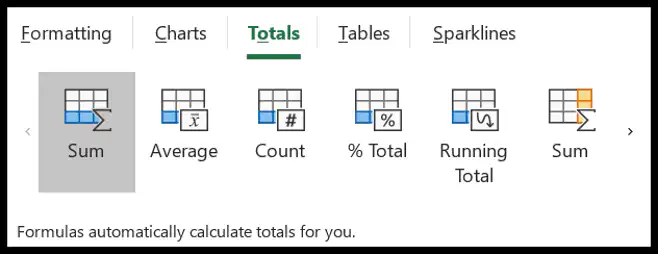
- Total: From this tab, you can quickly add some of the basic formulas, like average count, running total, and many more.
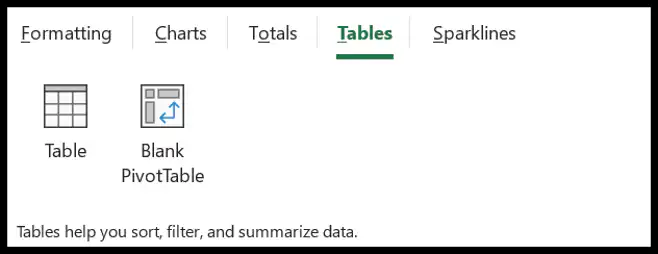
- Table: From this tab, you can insert a pivot table with the selected data, and you can also apply an Excel table to it.
- Sparklines: This tab allows you to add sparklines which are basically tiny charts that you can create within a cell.
Advanced Excel Skills
Advanced Excel skills are more about solving complex problems and making you efficient to do all the work done in Excel, and below you have top advanced Excel skills that you need to master.
21. Advanced Excel Formulas
An ADVANCED EXCEL FORMULA (Excel Formulas List) means combining different functions to calculate a specific value that is not possible to calculate otherwise. Below is a list of some of the most important ones:
More on Formulas
- Average Highest Values
- Calculate Time Difference
- Compound Interest Calculator
- Concatenate with Line Break
- RANK IF
- SUMPRODUCT IF
- Count Cells with Text
- COUNTIF OR
- Count Unique Values
- Count Words
- Total Days in a Month
- Get End of Month Date
- Excel 3D Range
- Random Letters Generator
- Extract Day from Date
- Extract the First and Last Word
- IFERROR with VLOOKUP
- INDEX MATCH
- Add Leading Zeros
- MAX IF
- Get Month from Date
- Quarter Formula
- Calculate Ratio
- Remove Extra Spaces
- Remove First Character
- Sentence Case
- Square Root
- SUMIFS OR
- SUMIFS Wildcard
- SUMIF Between Two Dates
- Two Way Lookup
- VLOOKUP MATCH
- Weighted Average
- VLOOKUP Wildcard
22. Advanced Excel Charts
As you have already seen that you can create most of the charts in Excel with a few clicks, but apart from all those charts you can also create some advanced charts.
Advanced Excel Charts are for a specific purpose and need you to spend a few minutes learning how to create and how they presented data. Below you have a list (tutorials) for some of the Advanced charts that you can learn to create in Excel.
23. Visual Basic for Applications
VBA is an object-oriented programming language for Microsoft office applications, and you can use it in Excel to write VBA codes to automate the activities that you normally perform manually.

24. Power Query
If you work with data, I’m sure you face this situation where you need to clean and transform data before you use it.

Now the thing is cleaning data and transforming data is a tedious process and you need to spend a big chunk of your time on it every day. But with the power query, you can do this entire process of cleaning and transform with a few clicks.
Power query basically works as an ETL where you can extract data from different sources, transform it, and then load it back to the worksheet. Check out this complete tutorial on Power Query and do not forget to learn to combine multiple Excel files.
25. Power Pivot
Power Pivot is basically a data modeling technique that you can use to import data of millions of rows, from multiple sources, and then perform calculations (DAX).

To get started with Power Pivot – Power Pivot – Overview and Learning
Learn More