Written by Puneet for Excel 2013, Excel 2016, and Excel 2019
-
It’s a collection of options for data analysis.
-
You can’t add or delete options from it.
-
It is not listed anywhere on the ribbon.
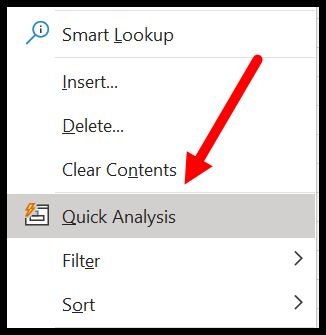
What is the Quick Analysis Tool?
The QUICK ANALYSIS TOOL is a collection of selected options that you can use to analyze the data quickly. It includes conditional formatting, charts, pivot table, and sparklines. It also takes care of what type of data (text, dates, or numbers) you have selected and show you the options based on that.

Quick Analysis Tool was introduced with Excel 2013, so if you are using Excel 2010 or any lower version, you won’t be able to find this option. Most of the options that you have on the quick analysis tool are fixed, but few of them are based on the selected data type.
For example, in the conditional formatting tab, you will have different options when you select dates comparing if you select numeric data. When you hover over any option from the quick analysis tool, it shows you a sneak peek at selected data.
Where the Quick Analysis Tool is Located in Excel Ribbon
The button to open the quick analysis tool is not listed anywhere on the Excel ribbon. When you select the data, Excel shows you a small icon on the bottom right side, and when you click on this icon it opens the quick analysis tool.

Quick Analysis Tool is in our list of Intermediate Excel Skills.
But I’m not Able to See the Quick Analysis Tool Button
If somehow you are not able to see a quick analysis button when you select the data (a very little chance of this), you need to check if it is disabled from the options. Go to File Tab ➜ Options ➜ General ➜ Tick Mark (Show Quick Analysis options on selection)

As I said, it was introduced in Excel 2013; if you are using any version lower than that, then you need to upgrade to the latest version.
Keyboard Shortcut to Open Quick Analysis Tool
Yes, there is a keyboard shortcut to open the quick analysis tool.
Ctrl + Q
You need to select the data, and then you need to press this keyboard shortcut.
Excel Keyboard Shortcuts Cheat Sheet
Here is one more benefit. If a quick analysis tool is disabled in the Excel options, you can still open it using the keyboard shortcut. You can also activate the quick analysis button from the right-click menu.
How to use the Quick Analysis Tool
- First, select the data you want to analyze.
- Click on the quick analysis button from the bottom right.
- Go to the tab from where you want to use the option.
- Click on the option that you want to use.
Notes
- Excel will not show you the quick analysis button if you select blank cells.
- And, if you have selected the entire column or a row.
How to use the Quick Analysis Tool for Data Analysis – Tips
1. Quickly Create Data Bars
This option comes in handy when you work with numeric data (conditional formatting data bars).

You need to click on the quick analysis button and the formatting tab and then select the “Data Bars” option. It will instantly add solid data bars (Blue) to the selected data. It is quick, right?
And if you want to change the color or want to make other customizations, go to Home Tab ➜ Styles ➜ Conditional Formatting ➜ Manage Rules.

Related: Formulas in Conditional Formatting
2. Analyze Dates with Quick Analysis Tool
If you have dates in your data, then you can quickly analyze them using the quick analysis tool. When you open it, it shows you some quick conditional formatting options to analyze dates.

- Last Month: With this option, you can highlight all the dates that are from the previous month.
- Last Week: To highlight all the dates from the previous week.
- Greater than: Highlights all the dates which are greater than the date you specify.
- Less Than: Highlights all the dates which are lower than the date specified.
- Equals To: Highlights all the dates which are equal to the date you specify.
3. Create a Pivot Table with the Quick Analysis Tool
When you click on the quick analysis button and go to the tables tab, it shows you options to insert a pivot table.

Based on the data that you have selected; it shows you all the possibilities to create a pivot table. If you don’t want to go with recommendations, you can click on the More button and open the recommended PivotTables and click on the blank pivot table to create a pivot from scratch.

Related: Advanced Pivot Tables
4. Create In-Cell Charts with Sparklines
You can insert an in-cell chart using sparklines, and you can add sparklines quickly from the quick analysis tool.
- Select the data where you want to add the sparklines and click the quick analysis button.

- Go to the sparklines tab and select the type of sparkline that you want to insert.
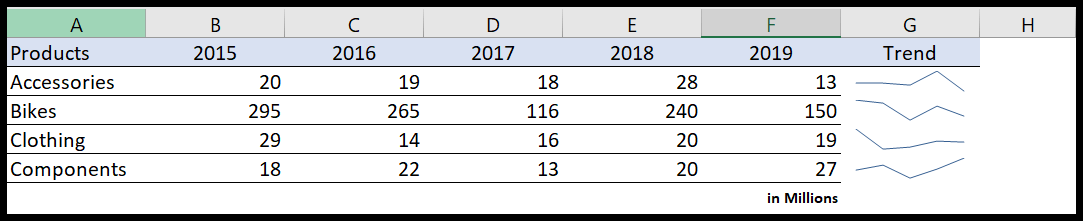
You will instantly get the sparklines in the cells corresponding to the data that you have selected.
5. Quickly Add Grand Totals
In the totals tab, you have multiple ways to add totals, and it also gives you options for both columns and rows.

- Sum: To add a total row or column to the table.
- Average: To add an average row or column to the table.
- Count: To add an average row or column to the table.
- % Total: To add an % total row or column to the table.
- Running Total: To add a running total row or column to the table.
6. Highlight Unique and Duplicate Values
When you select text data, you will have the option to identify unique and duplicate values.

The moment you click on any of these two options, it will highlight the cells with unique or duplicate values with the red color.