What is the Coefficient of Variation?
The coefficient of variation is a statistical measure that helps you understand how much variation is in the data compared to the average. Let’s say you have sales data for different months and want to see how consistent your sales are. The CV gives you a percentage that shows how much your sales numbers vary from the average sales figure. A lower CV means your sales are more stable, while a higher CV indicates more fluctuation.
It is calculated as the ratio of the standard deviation to the mean and is often expressed as a percentage. A lower Coefficient of Variation means a more precise estimate.
In Short – Coefficient Variation measures data’s dispersion (variability) around its mean. The lower the coefficient of variation, the lower the level of dispersion that you have in the mean of data points.
✅ CV = (Mean / Standard Deviation) × 100
Now, let’s return to Excel: To calculate the coefficient of variation in Excel, you can combine the STDEV.P and AVERAGE functions. There are three steps to calculate the Coefficient of Variation:
- Calculate Standard Deviation
- Calculate Mean
- Divide Both
Instead of using any complicated formula, one simple formula you can use to calculate the Coefficient Variation in Excel is Standard Deviation/Mean
=STDEV.P(data_range) / AVERAGE(data_range)
Replace data_range with the actual range of your data. This formula calculates the standard deviation of the data set (using STDEV.P), then divides it by the average of the data set (using AVERAGE), giving you the CV.
In this formula, STDEV.P will help you get the standard deviation, and the average function will help you to get the average of the data points.
In the end, you need to divide the standard deviation by the average to get the coefficient of variation. You can also say it’s like dividing the standard deviation by the mean of the data.

In the above simple example, you have the following data with seven different data points, and now you need to calculate the CV (coefficient of variation) for these data points.
Steps to Calculate Coefficient of Variation in Excel
You can use the steps below to calculate the CV for our sample. Make sure to have the sample data from here to try it yourself.

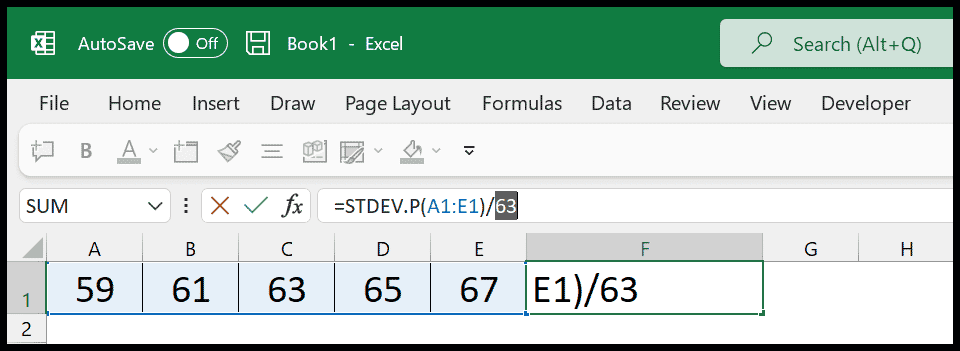
- First, enter the STDEV.P in cell F1 or the cell where you want to insert it. In the STDEV.P function, you need to refer to the range where you have the values. In our example, those values are in the range A1:E1.
- After that, close the function and enter a divide operator. This is required to divide the result from the STDEV.P with the average values.
- Next, enter the average function after the divide operator and refer to the range A1 to E1. This is the same range where we have all the values that we have referred to in the STDEV.P function
- Finally, enter the closing parentheses and hit enter to get the result. And the moment you hit enter, you will get the result
=STDEV.P(A1:E1)/AVERAGE(A1:E1)
Note: The result you get from this formula will always be in the numbers, but here, you need to apply the percentage format to the cell, and for this, you can use the keyboard shortcut Ctrl + Shift + %. If you have calculated multiple calculations, select all those cells and then use the keyboard shortcut.
How this Formula Works
As I said earlier, to understand this formula, we need to split it into two parts. The STDEV.P function calculates the standard deviation in the first part by ignoring logical values and blank cells. Ignoring these is important because they can mislead the final result.

In the second part, we have the average function, which calculates the average of the data points. The formula bar shows that the average value is 63. That number will help you get the average standard deviation.
In the end, when you divide 2.82842712474619 by 63, you get 0.04, which, when converted to percentage format, is 4%.
Interpreting the Coefficient of Variation
The result we have in cell F1 is 4%. It means that the standard deviation of our data set is 4% of the mean. In simple terms, our data points (59, 61, 63, 65, 67) vary by about 4% from the average value of these numbers.
This low CV value suggests that your data points are close to the average, indicating consistency and low variability in the data set.
Some of the Benefits of the CV
The Coefficient of Variation (CV) offers several key benefits that make it a valuable measure for data analysis:
- Comparative Measure: It allows you to compare the relative variability of data sets with different units or widely differing means.
- Risk Assessment: CV is used to assess risk in finance and investment. It helps investors understand the risk per unit of return, allowing for a better comparison of the risk associated with different investments.
- Quality Control: CV can be used to measure process stability and product consistency in manufacturing and production. A lower CV indicates higher quality and less variation in the production process.
STDEV.P Vs. STDEV.S
There are two ways to calculate the standard deviation in Excel. In this example, we used the STDEV.P, which considers the data an entire population. That’s the reason it has a P in its name. But you can also use STDEV.S, where S stands for sample.
To understand the difference between the two, you can take this example: Let’s say the data you have of the class is just a few students (sample data). In this case, you can use STDEV.S; if that data is for the entire class, you can use STDEV.P.
When you use a sample instead of the entire population, the accuracy of the CV remains slightly less than that of the entire population. But still, it depends on the method you want to use.
Points to Remember
There are a few essential points to remember when calculating Excel’s coefficient of variation (CV).
- Make sure to define the same range for both of the functions. Both calculations must be from the same data set; otherwise, the result will be incorrect.
- You can choose between STDEV.P and STDEV.S according to your data type. We have discussed it in detail earlier in this tutorial.
(Updated) VBA Code to Create a Custom Function
If you frequently calculate CV in your work, you can use the code below, which creates a custom function in Excel to calculate the Coefficient of Variation.
Function CoefficientOfVariation(dataRange As Range) As Double
    Dim mean As Double
    Dim stdDev As Double

    ' Calculate the mean of the data range
    mean = Application.WorksheetFunction.Average(dataRange)

    ' Calculate the standard deviation of the data range
    stdDev = Application.WorksheetFunction.StDev_P(dataRange)

    ' Check if the mean is not zero to avoid division by zero error
    If mean <> 0 Then
        ' Calculate the Coefficient of Variation
        CoefficientOfVariation = (stdDev / mean) * 100
    Else
        ' Return an error value if the mean is zero
        CoefficientOfVariation = CVErr(xlErrDiv0)
    End If
End Function
Press Alt + F11 to open the Visual Basic for Applications (VBA) editor. In the VBA editor, go to Insert > Module. This adds a new module where you can write your VBA code. Paste the code there and enter the below function in your worksheet.
=CoefficientOfVariation(A1:E1)