

Go to Insert → Add-ins and click the small green People Graph icon. Excel places a graph with sample data on the sheet. If the icon is missing or greyed out, add it from Insert → Get Add-ins by searching for People Graph.
Click the Data icon at the top of the graph, choose Select Your Data, select a two-column range with the labels in the first column and the numbers in the second, and click Create. Type your own title in the same Data pane.
Use the Settings icon to pick one of 3 types, 7 themes and 12 shapes. That is the full extent of the formatting: People Graph is an Office add-in, not a built-in chart, so you can’t change the label fonts or edit it with the usual chart tools.
The graph doesn’t refresh on its own. After you change the source values, click the graph once to update it. A macro can’t drive it either, because VBA has no access to Office add-ins, so values a macro writes appear only after someone clicks the graph.
For more control, build a pictograph instead: create a bar chart, copy a person icon (from Insert → Icons or any image), then select the bars and use Format Data Series → Fill → Picture or texture fill → Clipboard with Stack and Scale with set to the number each icon should stand for.
I have been always fascinated with info-graphics and story-based visuals. These kinds of things help me to tell a story with data. A pictograph is a great example of this. But apart from this, there is a chart in Excel which most of us are not aware of.
That’s called: People Graph
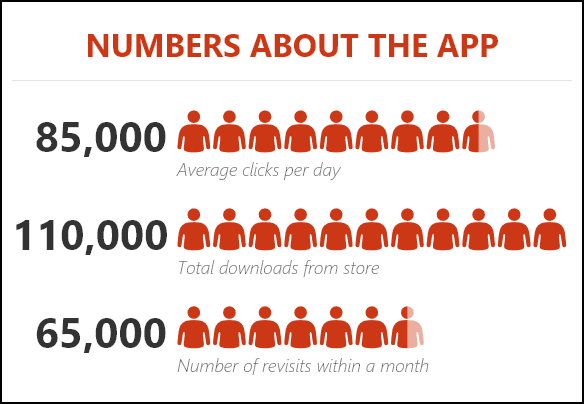
It was first introduced with Microsoft Excel 2013 (as an Office add-in that comes with Excel) to help people create infographics. In a people graph, instead of a column, bar, or line, we have icons to present the data. And, it looks nice and professional.
Today, in this post, I’d like to share simple steps to insert a people graph in Excel and the options which we can use with it. So let’s get started.
7 Steps to Insert a People Graph in Excel
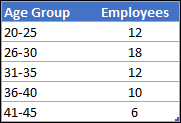
Creating a people graph in Excel is simple and easy; we just need a few clicks. Here is the data table which I’m using here. A people graph needs exactly two columns: one for the labels and one for the values.
- First of all, go to Insert Tab ➜ Add-ins ➜ click on the small green People Graph button. The first time, Excel asks you to trust the add-in; click “Trust this add-in”.

- It will insert a people graph with dummy data.
- Now, your next step is to connect data with the chart.

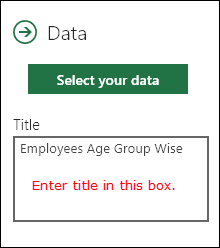
- Click on the Data icon and then click on the Select Your Data button.
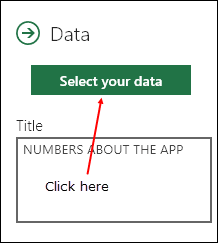
- Now, select the data table and click on the Create button.
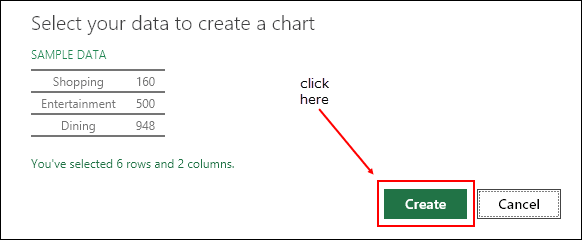
- The last thing is to add a title for your chart.
- Again, click on the Data icon and change the default title to the desired title.
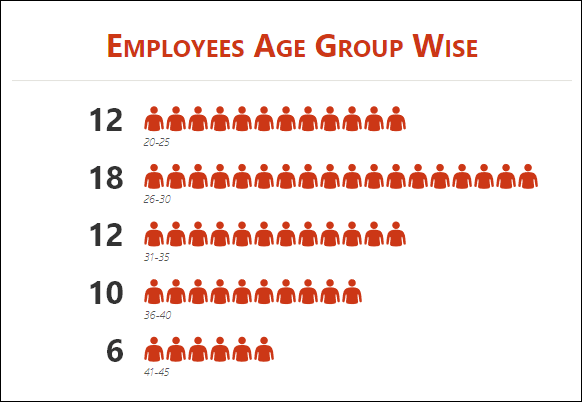
Congratulations! Your first info-graphic is ready to tell its story. It’s a proud moment.
Customization and Other Options
As I said, it’s easy to insert a people graph. But there are some customization options that you can use after that.
1. Chart Type
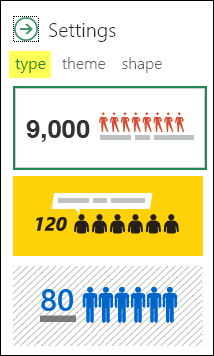
There are 3 pre-defined chart types that we can use. Click on the Settings button (the gear icon) and select the type which you want.
2. Theme
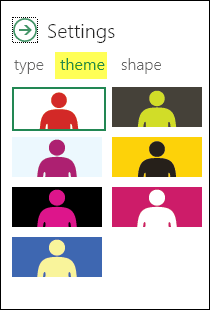
We can also use different themes for our chart. There are 7 pre-defined themes that we can use. Click on the Settings button and select the theme which you want.
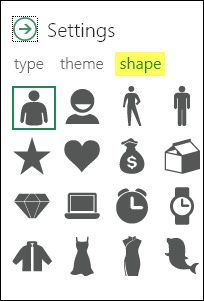
3. Shape (Icon)
We can’t use a single shape for all types of data. So that’s why there are different shapes from which we can select (12 when the add-in came out, 16 in current versions). Click on the Settings button and select the shape which you want.
4. Save as Image
There is an option to save it as an image. With this, we can use it further in PowerPoint, send it in an email, upload it to the web, etc.
5. More
- When you update any value in the source data, the graph updates on its own; if it doesn’t, click on the graph once to update it.
- You can also paste it as an image in the worksheet with copy and paste.
People Graph Limitations
- Two columns only: the data must have one label column and one value column, so you can’t show two series in one graph.
- Add-in based: it’s an Office add-in, so it may be missing if your organization blocks add-ins, and it needs an internet connection the first time you insert it.
- Rounded icons: the icons are a visual guide, and the exact numbers show next to them, so don’t use it where you need precise comparison.
- Not a normal chart: you can’t format it with the chart tools; you only get the type, theme and shape options.
If you need more control, a pictograph made with a normal bar chart and icons gives you the same look with all the chart options.
Conclusion
Infographics are superb at presenting data in a vivid way. And I believe that creating a people graph in Excel is really fun.
You can also use it in your dashboards and templates to give them an awesome look and to help others understand the data. I’m sure you found this graph useful and it will help you in your work.
Now tell me one thing.
Have you ever tried this before? And do you think we can use it in our dashboards?
Please share your views in the comment section; I would love to hear from you. And, don’t forget to share this charting tip with your friends.
Frequently Asked Questions
Why can’t I find People Graph on the Insert tab?
Look in the Add-ins group of the Insert tab. If the button isn’t there, go to Insert ➜ Get Add-ins (or My Add-ins), search for People Graph and add it. If add-ins are turned off by your organization, ask your admin.
Does a people graph work on Mac?
Yes. People Graph is an Office add-in, so it works in Excel for Microsoft 365 on Windows and Mac, and in Excel for the web.
Can I use my own icons in a people graph?
No. You can only pick from the built-in shapes. For your own icons, create a pictograph with a bar chart instead.
More Charting Tips and Tutorials
- How to Add a Horizontal Line in a Chart in Excel
- How to Add a Vertical Line in a Chart in Excel
- How to Create a Bullet Chart in Excel
- How to Create a Dynamic Chart Range in Excel
- How to Create a Dynamic Chart Title in Excel
- How to Create Interactive Charts In Excel
- How to Create a Sales Funnel Chart in Excel
- How to Create a HEAT MAP in Excel
- How to Create a HISTOGRAM in Excel
- How to Create a Pictograph in Excel
- How to Create a Milestone Chart in Excel
- How to Create PIVOT CHART in Excel
- How to Create a Population Pyramid Chart in Excel
- How to Create a SPEEDOMETER Chart [Gauge] in Excel
- How to Create a Step Chart in Excel
- How to Create a Thermometer Chart in Excel
- How to Create a Tornado Chart in Excel
- How to Create Waffle Chart in Excel
Thanks for giving most useful information.
The people graph is a great tool. Will you be able to use more than two columns to tell you story?
Thanks
Hi Puneet,
How do it format the labels on the People graph. When I choose a particular type the labels for the age group I want to make it ‘ bold’. How do I do that.
Thanks for sharing.
I’m afraid that there’s no option that can help you to customize this chart because it’s more of a add-in. But here’s the link to create a pictograph where you can add an icon in the chart to and make all the customization that you need.
https://excelchamps.com/excel-charts/pictograph/
take care
Hello Puneet
Please do you have an idea about people graph.
someone sent me this “I have a question regarding Microsoft People Graph and installing it for a small group of users. Looks like it trying to do centralized deployment of the app”
How is it possibele to use this chart in a vba makro? Our figures are not getting updated.
During a VBA makro the data is not updated in the graph – how can I achieve this?
There is a limitation of using this people graph, it is not showing the data more than 15 rows and I am unable to see the full graph even 10 rows are, it is displaying only 4 rows.
How can you get the images to represent a smaller population? I am trying to represent pregnancies per 1000 and it wants to represent per 10 not per 1.
can’t seem to find the link to download the data table
In the first of the seven steps you say, “Here is the data table …”. that is NOT a data table. It is not even, formally, a table. It’s a list or a range. At best it’s a frequency distribution table.
Thanks for correcting me.
Dear Puneet, Thanks for Sharing People Graph. I have never use this type of graph. Thanks
There’s always something new to learn, Imran.
Hi Puneet,
That’s great and useful for me the people graph. But for me the Green People graph was not highlighted.
Please help me how to get it.
You mean green icons and black background.
Yes….. I am using excel 2016 please suggest me how to get that icon highlighted
@narmadabachoti:disqus Please share a snap-shot
https://uploads.disquscdn.com/images/c4dde740a88a8bdd2888619b1194e39b8b8d5fce217f898ed14353d849b654ef.png
Use this link to reinstall ==> https://store.office.com/en-us/app.aspx?ui=en-US&rs=en-US&ad=US&assetid=WA104104476&appredirect=false