What is a Pie Chart?
A Pie Chart is a graph that displays data in a circular format, with ‘slices’ representing different categories. The size of each slice corresponds to the proportion of the category’s total. Pie charts are commonly used to compare relative proportions of categories, making them helpful in displaying demographic information, survey results, or budget allocations.
Types of Pie Charts in Excel
There are a few types of pie chart which you can create in Excel:
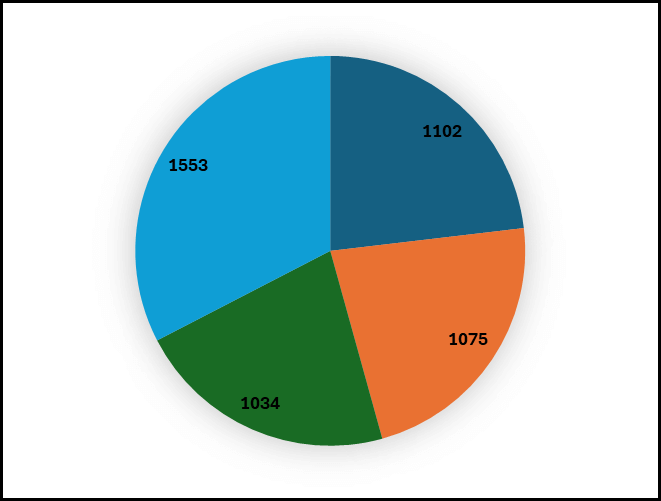
1. Standard Pie Chart
This is the basic type of pie chart that represents categories’ proportions of a whole by dividing a circle into sectors.
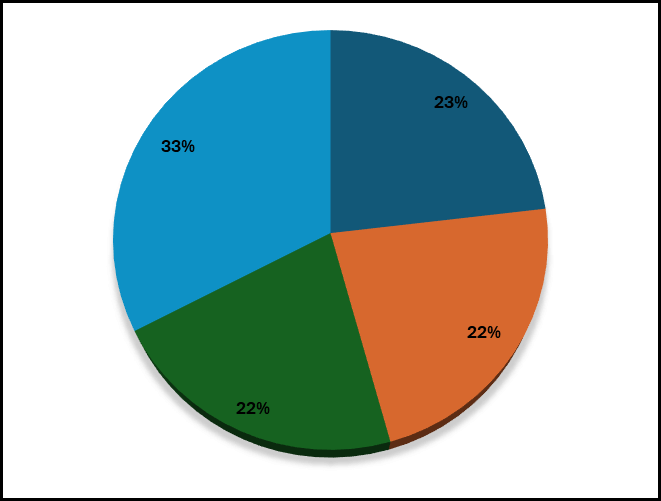
2. 3-D Pie Chart
This pie chart gives the standard pie chart a 3-dimensional look. It doesn’t add any additional functionality but enhances the visual appeal of the chart.
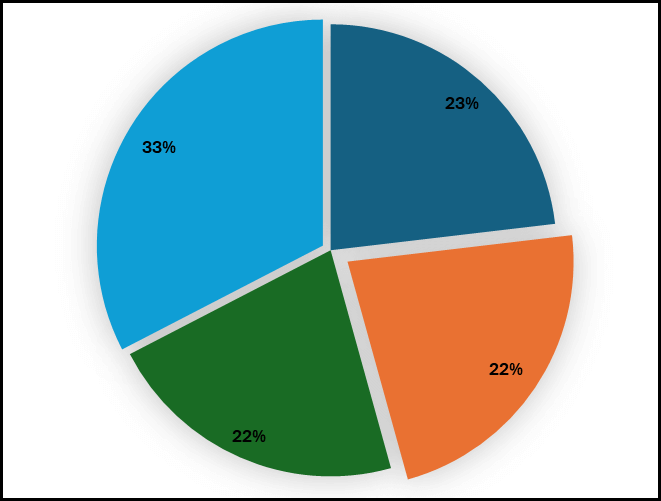
3. Exploded Pie Chart
This is a pie chart in which a slice or more slices of the pie is separated from the rest of the chart. This slice, which is ‘exploded’ out, allows for emphasis on this data point. It is useful for highlighting a specific portion of the pie chart.
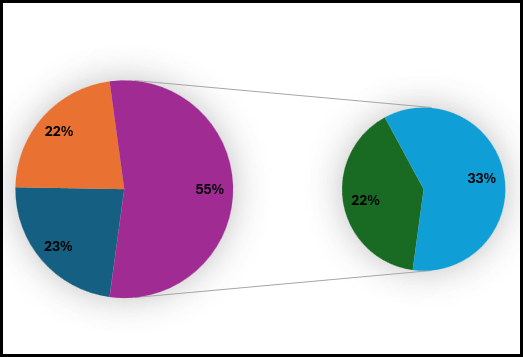
4. Pie of Pie Chart
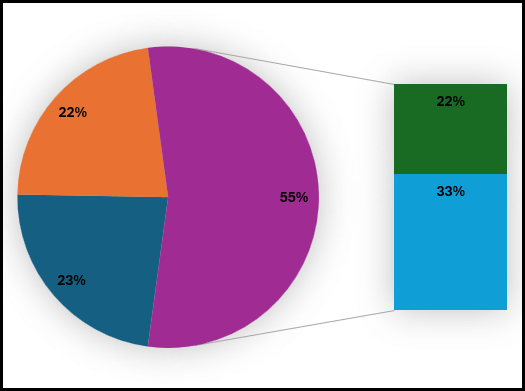
A Pie of Pie Chart in Excel is a type of chart that displays the main pie chart and a separate smaller pie for a pie of the main chart broken down into further detail. This type of chart is particularly useful when you have a pie chart with many small slices that are hard to distinguish.
5. Bar of Pie Chart
Like the pie of pie chart, this type of chart shows the break-up of categories clubbed into one category in the form of a bar chart instead of a pie chart.
Steps to Create a PIE Chart in Excel
To create a pie chart in Excel, follow these step-by-step instructions.
This guide is useful for most of the used versions of Excel, such as Excel, 2013, 2016, 2019, and Excel for Office 365:
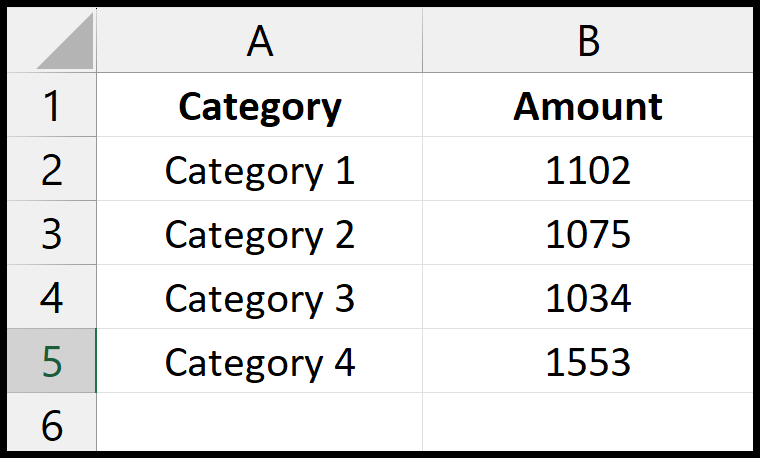
- Prepare Data: Arrange the data in two columns in your sheet. The first column should list the categories you want to represent as slices in the pie chart, and the second column should list the corresponding values for each category.
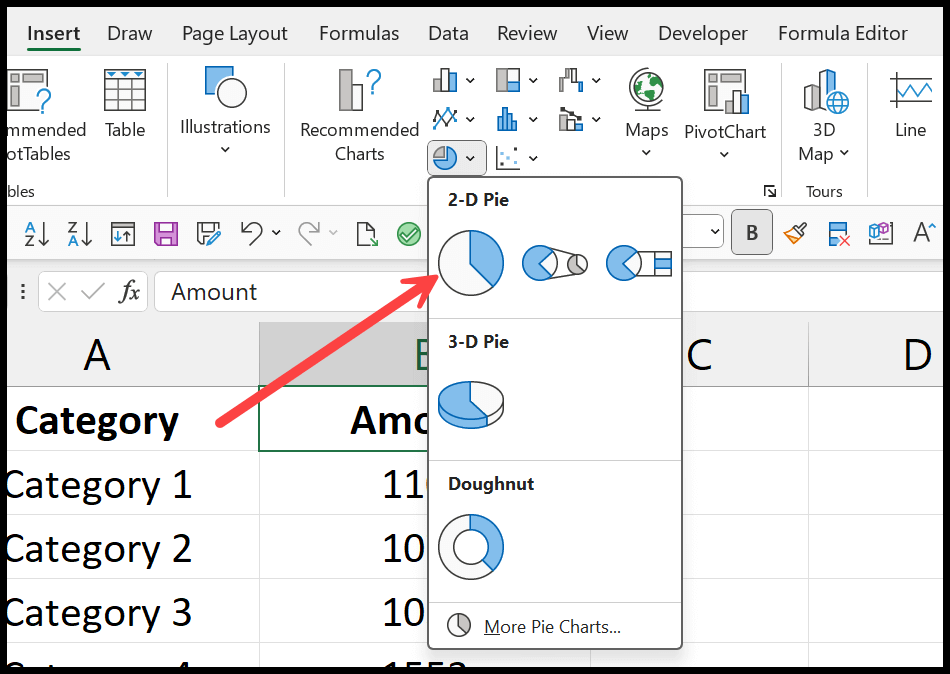
- Go to Insert Tab: Once you select the data, go to the “Insert” tab, which is located in the ribbon at the top of Excel. This is where you can find all the necessary tools and features to insert various charts into your worksheet.

- Open Pie Chart Option: After clicking on the ‘Insert’ tab, look for the ‘Pie Chart’ icon in the Charts group. Clicking on this icon will reveal several pie chart options you can add to your spreadsheet, including 2-D, 3-D, and Doughnut charts.
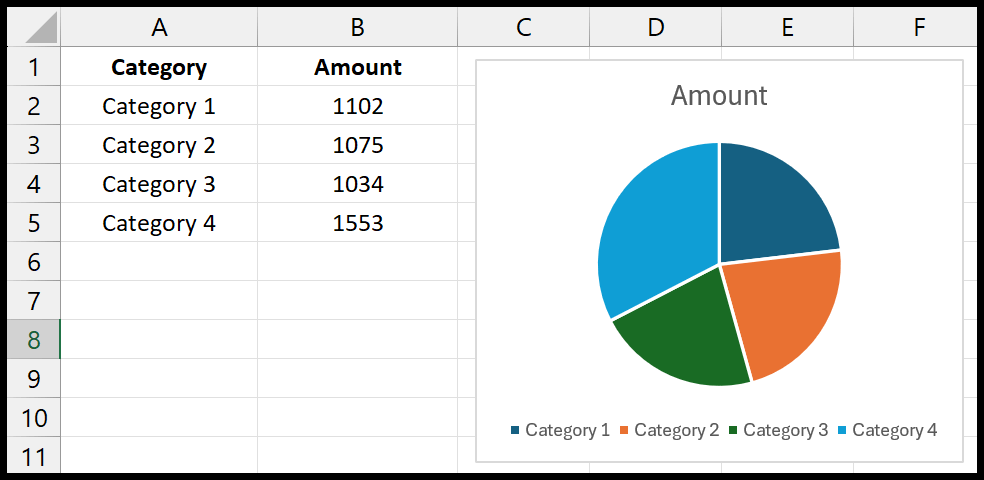
- Insert Pie Chart: Once you’ve selected the type of pie chart you want, Excel will automatically insert the pie chart into your spreadsheet. The chart will be based on the data you selected.
Add Labels to a Pie Chart
After your pie chart has been inserted, you may want to add labels to enhance its readability. To do this, right-click on the chart, then select “Add Data Labels” from the menu. After that, select “Add Data Labels” or “Add Data Callout” for even more detailed labeling.
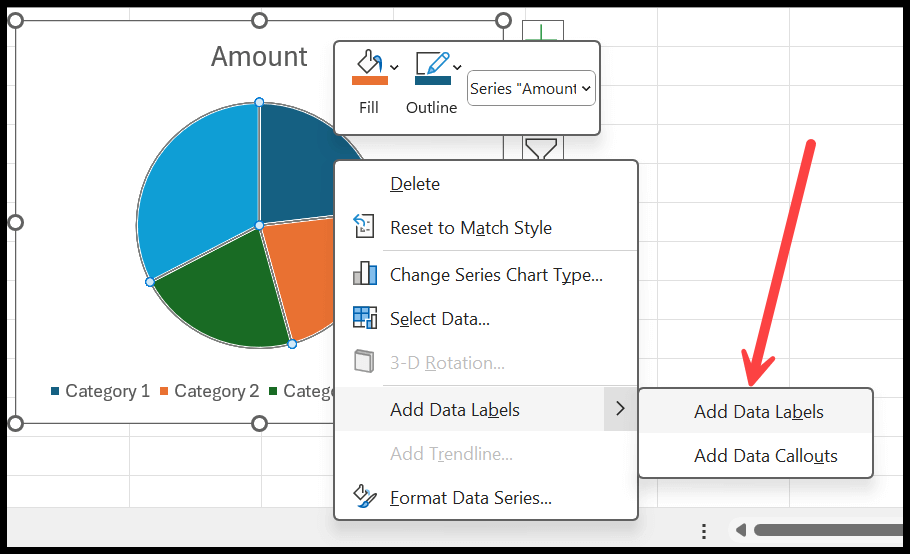
Now that your pie chart has been inserted and labeled, you can customize. Excel offers various customization options, allowing you to change the color, style, and format of the entire chart or individual slices. You can add a title, modify the legend, adjust the layout, and more.
Ahead in this guide, we will learn all the options and customizations available to use with the pie chart.
Changing Chart Style in Excel
In Excel, when you insert a pie chart it allows you to change the chart style with some pre-defined styles. Follow these steps to do it:
Click on the chart that you want to change the style of. This will activate the ‘Chart Tools’ tabs on the Excel ribbon. On the Excel ribbon, click on the ‘Chart Design’ tab. In the “Chart Styles” group, you can see a variety of pre-defined chart styles. Click on the style that you prefer to apply it to your chart.
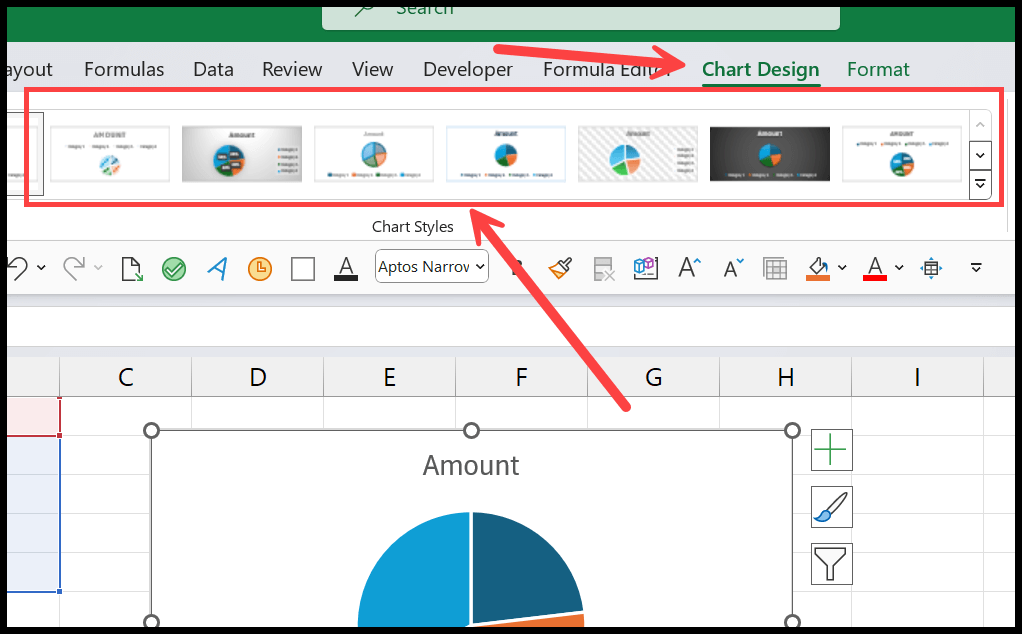
If the predefined styles do not meet your needs, you can customize the style by clicking on the ‘Format” tab and using all the options to change the style as per your need. Like chart border, chart background, font color and style, and other effects.

Adding Chart Title
When you insert a pie chart in Excel, you will have the chart title there. But if somehow if you don’t have the chart title, you can add it any time using the below steps:
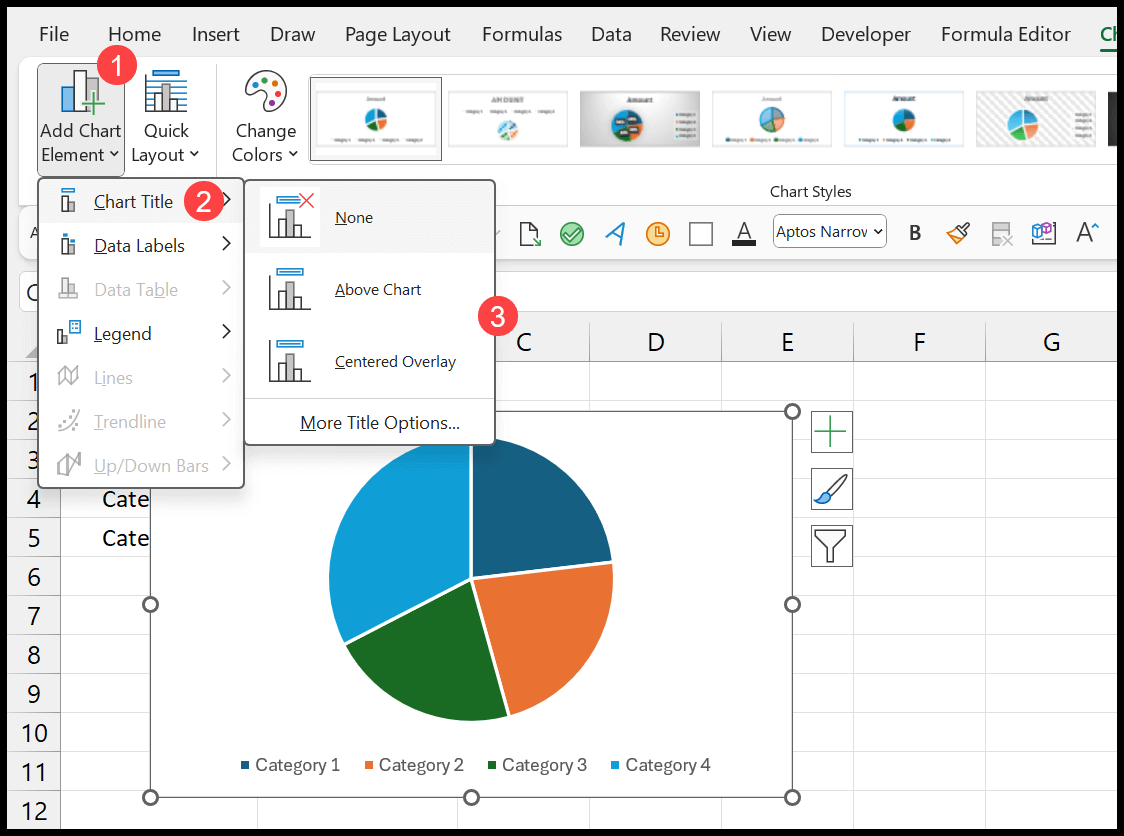
- Select the Pie Chart: First, click on the pie chart itself to select it. This action will bring up the Chart Tools in the Excel ribbon, adding the “Design” and “Format” tabs.
- Go to the Chart Design: Go to the “Chart Tools” section in the ribbon. If you’re using a recent version of Excel, this might be directly under a “Chart Design” tab.
- In the “Add Chart Element” option, open the dropdown. Now, hover over or click on “Chart Title” to see various placement options such as “Above Chart” or “Centered Overlay”.
Quickly Layout for Pie Chart
Quickly layout a chart in Excel, follow these steps:
- Select the chart: Click on the chart you want to layout. This will activate the “Chart Tools” tabs on the Excel ribbon.
- Go to the “Design Tools” tab: On the Excel ribbon, click on the “Design Tools” tab. In the ‘Chart Layouts’ group, you need to click on the “Quick Layout” drop down.
- Select Layout: Click on the layout that you prefer to apply to your chart.
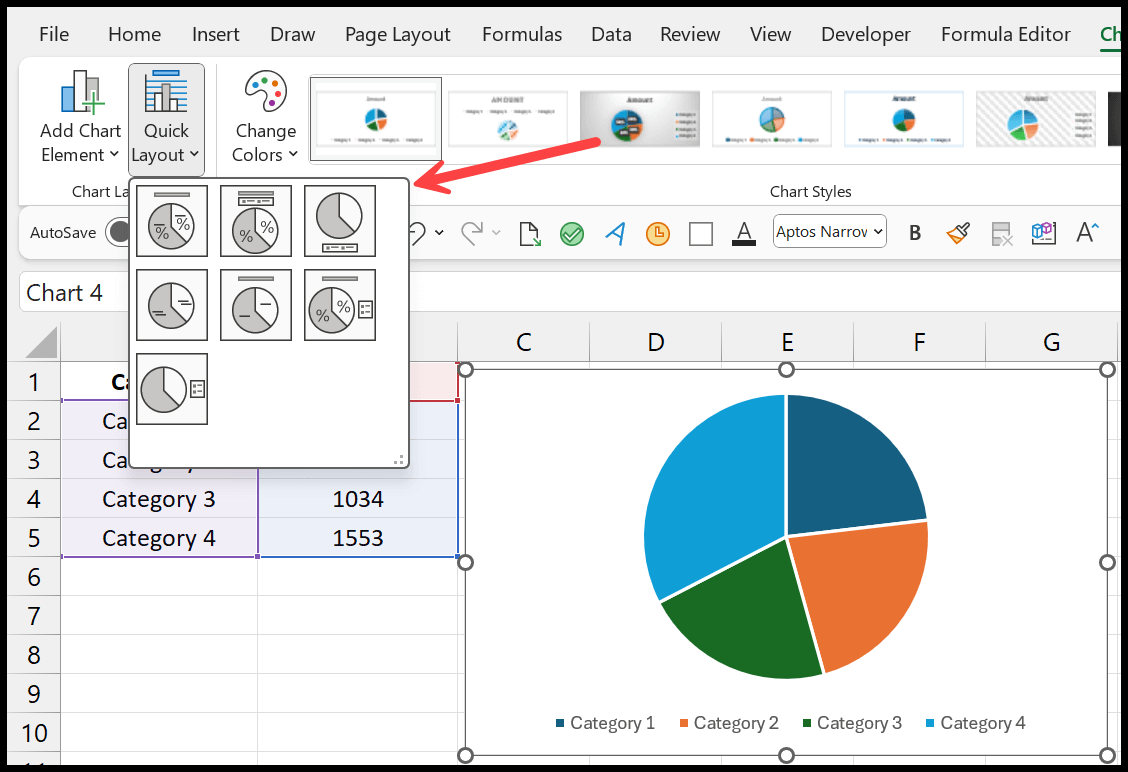
Chart Color Theme
When you insert a Pie chart or any other chart, Excel allows you have some pre-defined chart color to use. When you go to the “Chart Design”, you need to go to the chart style group and the click on the “Change Color” drop-down.
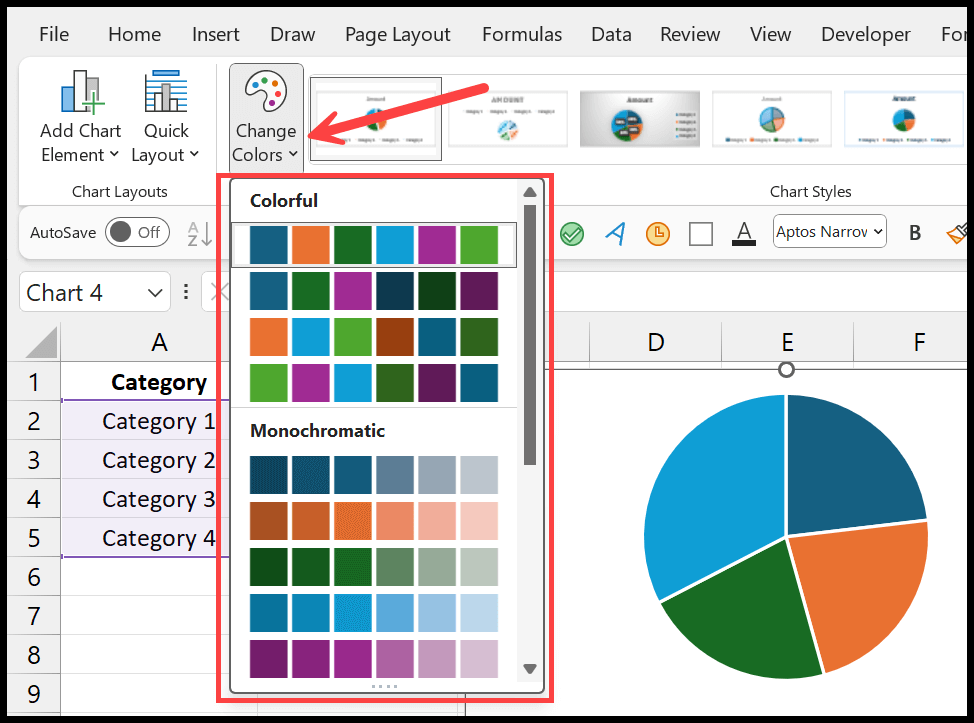
There are multiple-column themes you can use, as well as single and multiple-color themes.
Additional Formatting Options in a Pie Chart in Excel
Customizing a pie chart allows you to personalize your chart to best suit your needs. Here are the steps you can follow to open.
- First, select your pie chart by clicking on it. This will enable the “Chart Design” and “Format” tabs on the Excel ribbon.
- In the “Format” tab, you will find options to customize the appearance of your chart. By selecting the’ Shape Styles’ options, you can customize the entire chart’s color, texture, style, or individual slices.
- Legend: Excel provides options to customize the legend’s appearance and position. You can show or hide the legend, position it at different locations (e.g., top, bottom, left, right), and format its font and background.
- Chart Title: You can add a title to the pie chart to provide context or describe the represented data. You can use different fonts, sizes, colors, and alignments for the chart title.
- Background: You can customize the background of the pie chart area, including the chart area fill color, border color, and border style.
Apply Color to Each Slice Individually
- Click on the pie chart slice twice to select an individual slice. The first click selects the whole pie, and the second selects an individual slice.
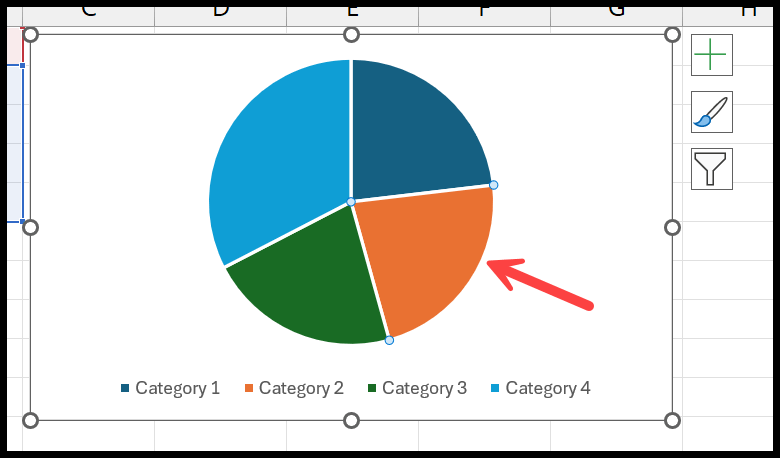
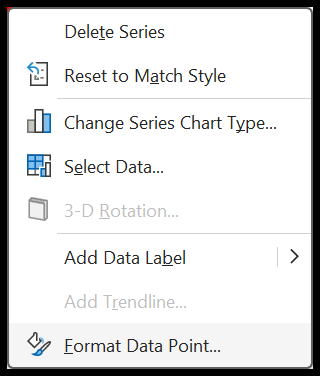
- Right-click on the slice you want to color. Choose Format Data Point from the context menu. It opens a side pane to format the chart.
- In the Format Data Point pane, click on the Fill & Line icon (it looks like a paint bucket). Under Fill, select Solid Fill. Then, choose the color you want for that slice.
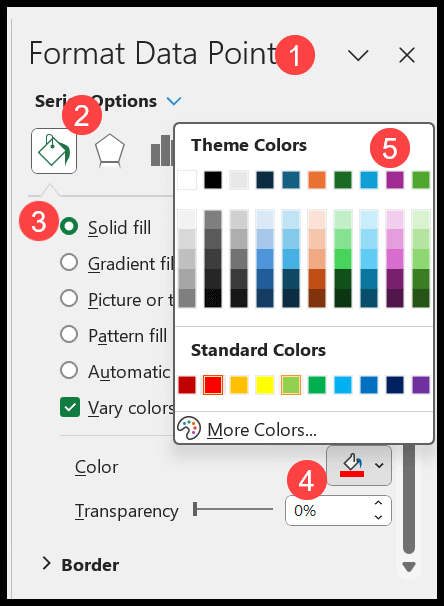
Adjusting Other Formatting: In the Format Data Point pane, you can change other formatting, such as border color and effects for the selected slice.
Exploding the Entire Pie Chart in Excel
Exploding a pie chart in Excel means separating each slice of the pie chart from the center, giving it a more explanatory view for the user.
Excel doesn’t provide a direct one-click option to explode all slices; a simple workaround involves adjusting each piece manually.
Show Percentages Data Labels on a Pie Chart
Using the percentage data label in a pie chart instantly conveys each category’s proportion relative to the whole. This is particularly useful in scenarios where the exact numbers are less important than understanding the distribution.
To display values as percentages on a Pie Chart in Excel, you can follow below steps:
- First, select the data labels from the pie chart and then right-click on a selected data label.
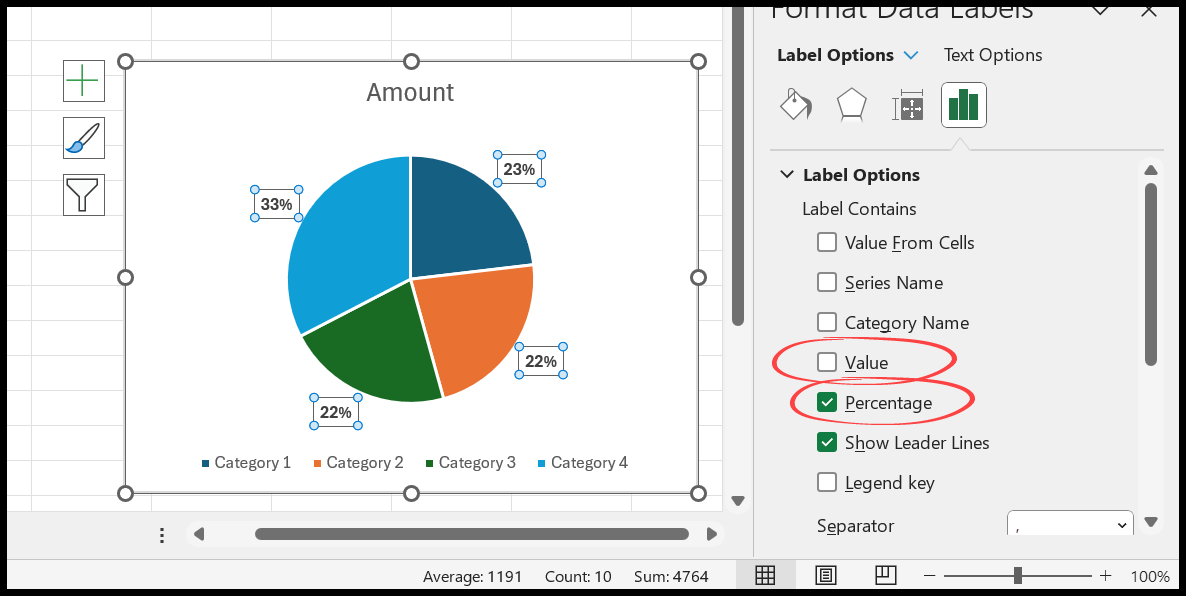
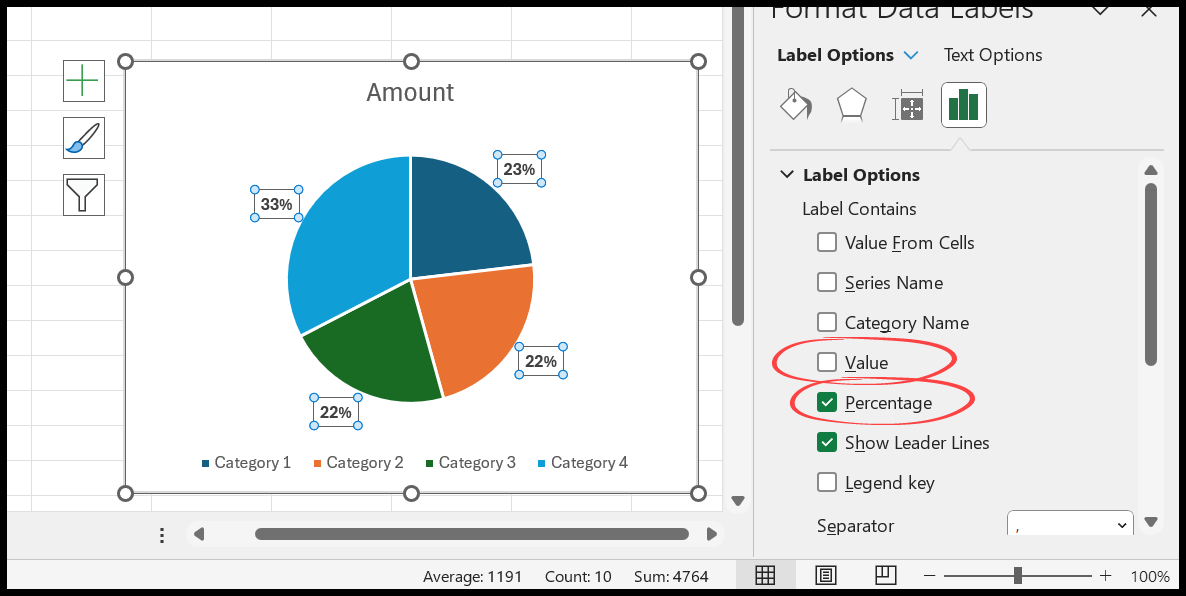
- In the “Format Data Labels” pane, look for an option that says “Percentage” under the “Label Options” tab. You can also uncheck the “Value” box if you only want to display percentages instead of actual values.
You can also adjust other options here, such as the position of the labels, whether to show leader lines and the font size.
Benefits of using Pie Chart in Excel for Presenting Data
- Simplicity: Pie charts are easy to read. They represent data visually, which can be more intuitive than looking at rows of numbers.
- Visual Representation of Proportions: Pie charts clearly show the relative size of data points, which can help understand proportions.
- Customizable: Excel offers many customization options, allowing you to adjust colors, add labels, and make your chart fit your presentation needs.
Limitations of an Excel Pie Chart
- Inability to Represent Negative Values: Pie charts cannot represent negative values or values that sum to zero.
- Comparing Slices: It can be challenging to accurately compare the sizes of individual slices in a pie chart.
- Can’t Show Trends: Pie charts are static data representations and cannot effectively convey trends or changes over time.
- Limited Number of Categories: Pie charts are most effective when representing a small number of categories.